In this blog post, I will discuss how one can use eBPF for runtime application security to detect library profile deviations. More specifically we will use stack traces to observe what libraries/functions are active in the stack when a system call is issued. Stack traces are very valuable signals

In this blog post, I will discuss how one can use eBPF for runtime application security to detect library profile deviations. More specifically we will use stack traces to observe what libraries/functions are active in the stack when a system call is issued.
Stack traces are very valuable signals for understanding the sequence of code executions that led to a particular event. There are different ways to walk a user stack, in this post, we will cover only python code stack.
Restricting a process based on system calls is not something new and has been around for a while. Examples include Seccomp-BPF , which limit the system calls available to a given application. However, available solutions operate at the application or process level and are not supply chain aware.
Before proceeding, I want to emphasize that using eBPF for library profiling was not my idea. AFAIK It originated from:


 avilum
I just wanted to give it a try (it was also a good opportunity to start learning eBPF), and since I spent a lot of time smashing RASP (reported several security issues to a Leader in the field), I wanted to see what kind of security eBPF promises and its drawbacks or holes for application runtime security.
Yet, my implementation is slightly different (I didn't manage to run secimport on my machine and I don't know for Oligo, they are probably more experimented and advanced on the subject).
I will discuss Python sandboxing, but the same principles apply for Java, Ruby, PHP, and other languages. The implementation is largely technology agnostic.
Before we start, here is a live demo, where eBPF is used to block a user request trying to exploit a simulated backdoor.
When developing a software solution, developers do not typically start from scratch. Instead, they often use third-party libraries or frameworks to help speed up the development process. For instance, if you are a Java developer and want to expose an API, you are probably not going to implement the socket API and all the necessary decoders and handlers. This would take too much time. Instead, you would use frameworks like Spring Web or Webflux, where the machinery for routing your requests is already developed, allowing you to focus on business logic, configuration, and security aspects. Even for security, you probably would not develop interceptors/decorators; instead, you would typically use Spring Security for this (at least for Java/Spring developers).
As one can see, we are delegating some of the most important and critical parts of the development process to the community, and we trust them.
However, vulnerabilities can exist, as we have witnessed with Spring4Shell, Log4Shell, and many other zero-day exploits. Not only are zero-day vulnerabilities a concern, but backdoors are also a critical issue. You can imagine the significant impact this could have on the banking and healthcare industries.
Over the years, RASP (Runtime Application Self-Protection) has tried to bridge the gap left by build time AppSec and network boundary controls . RASP typically works by instrumenting code (e.g. bytecode instrumentation, monkey patching...) and tracking tainted data throughout the user's journey. Before executing sensitive operations or sinks, RASP probes are fired, and then RASP modules can use the context within the application to vet whether a call can proceed.
However, most RASP solutions do not have any boundaries as they operate at the same privilege level as the user code, which is why they can be easily bypassed. I will not go into the details, but you can refer to my previous talk about RASP to understand why it is not always effective in protecting your software.
Today, we are not really going to talk about a replacement for RASP (RASP is more than just RCEs, and saying RASP can be replaced with eBPF based solution can be a hard statement, specially that I am not an eBPF expert). Instead, we will explore how one can use eBPF to detect library deviations.
If you look at most zero-day vulnerabilities, one or several libraries deviate from their expected behaviour and start issuing system calls not within their legitimate usage (this includes backdoors).
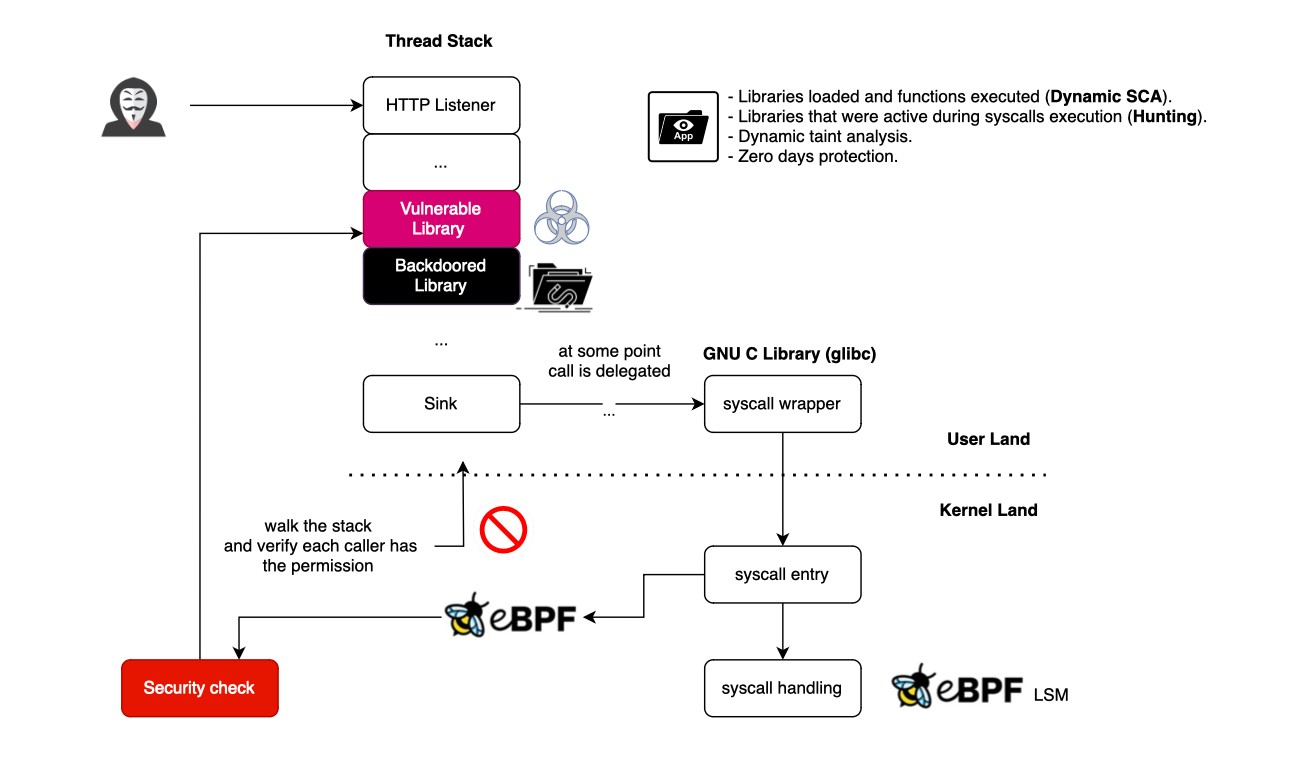
More specifically, we will use eBPF to give libraries a profile, and then track within each thread how these libraries are used. If it turns out that a library is misused (hijacked or manipulated), we would kill the process and report it.
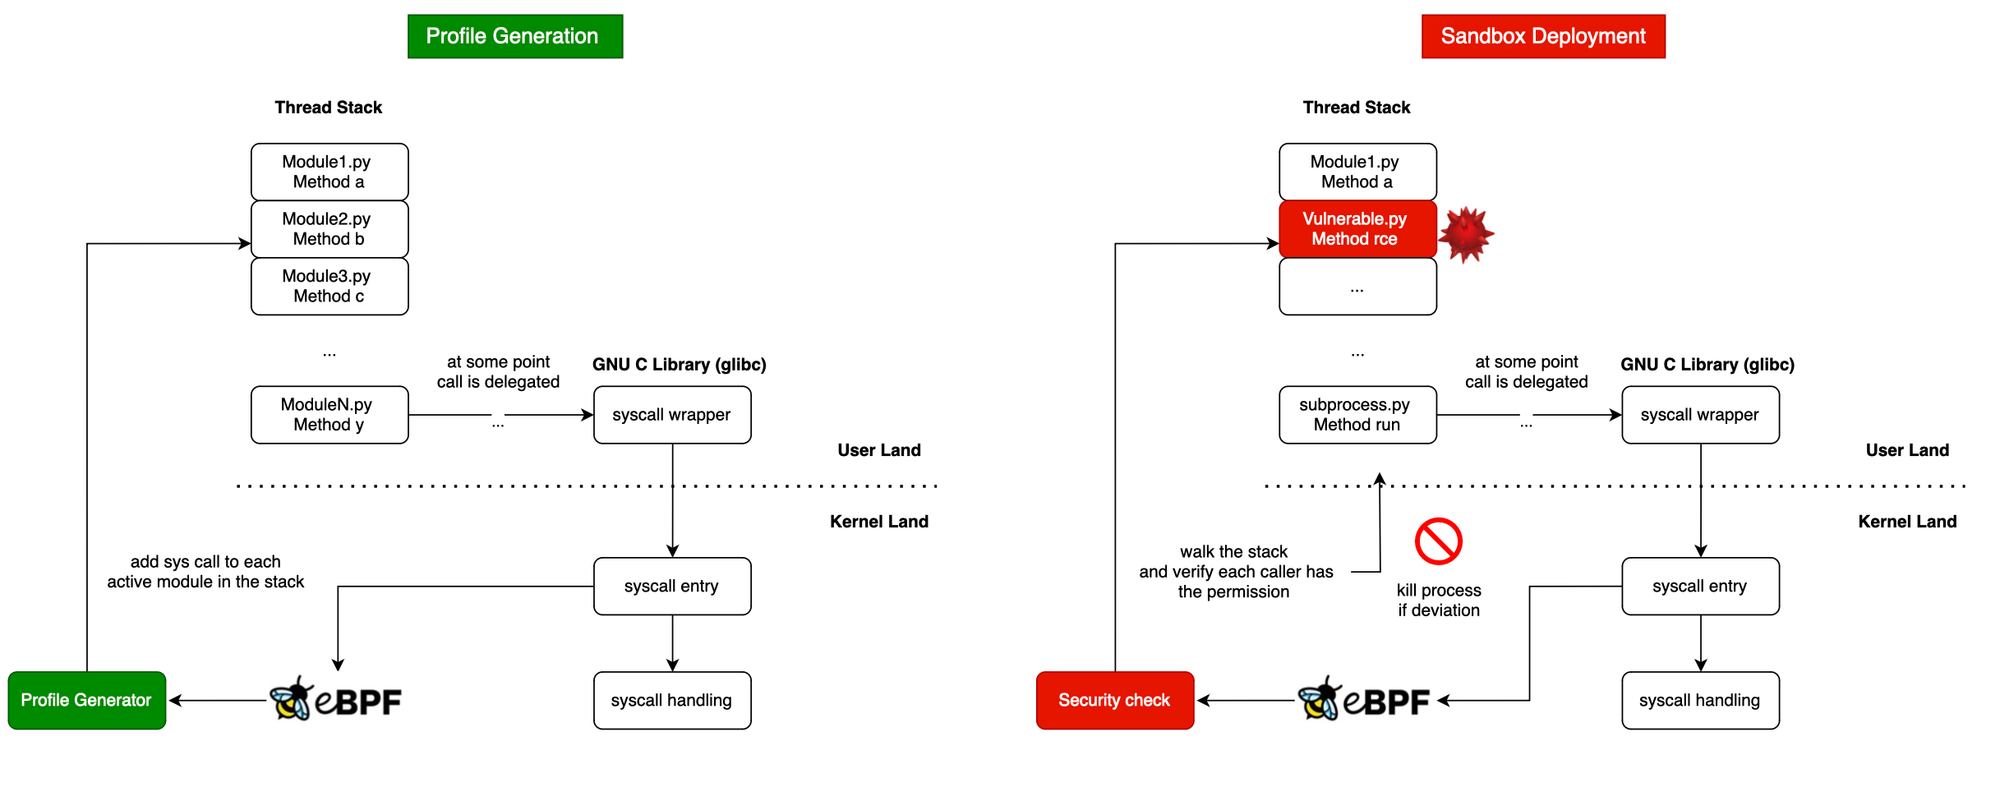
System calls are basically APIs that a user-space program can use to request access from the OS to perform sensitive operations, such as memory allocations and process spawning. In Linux, most applications access the Linux system call interfaces through glibc wrapper functions, which provide a C interface and hide the architecture-specific details of making a system call.
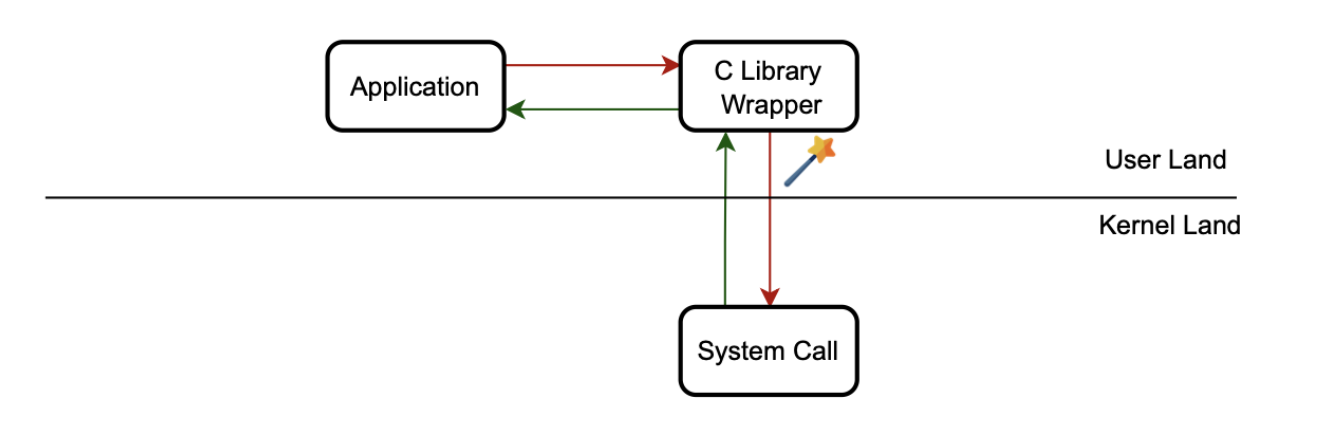
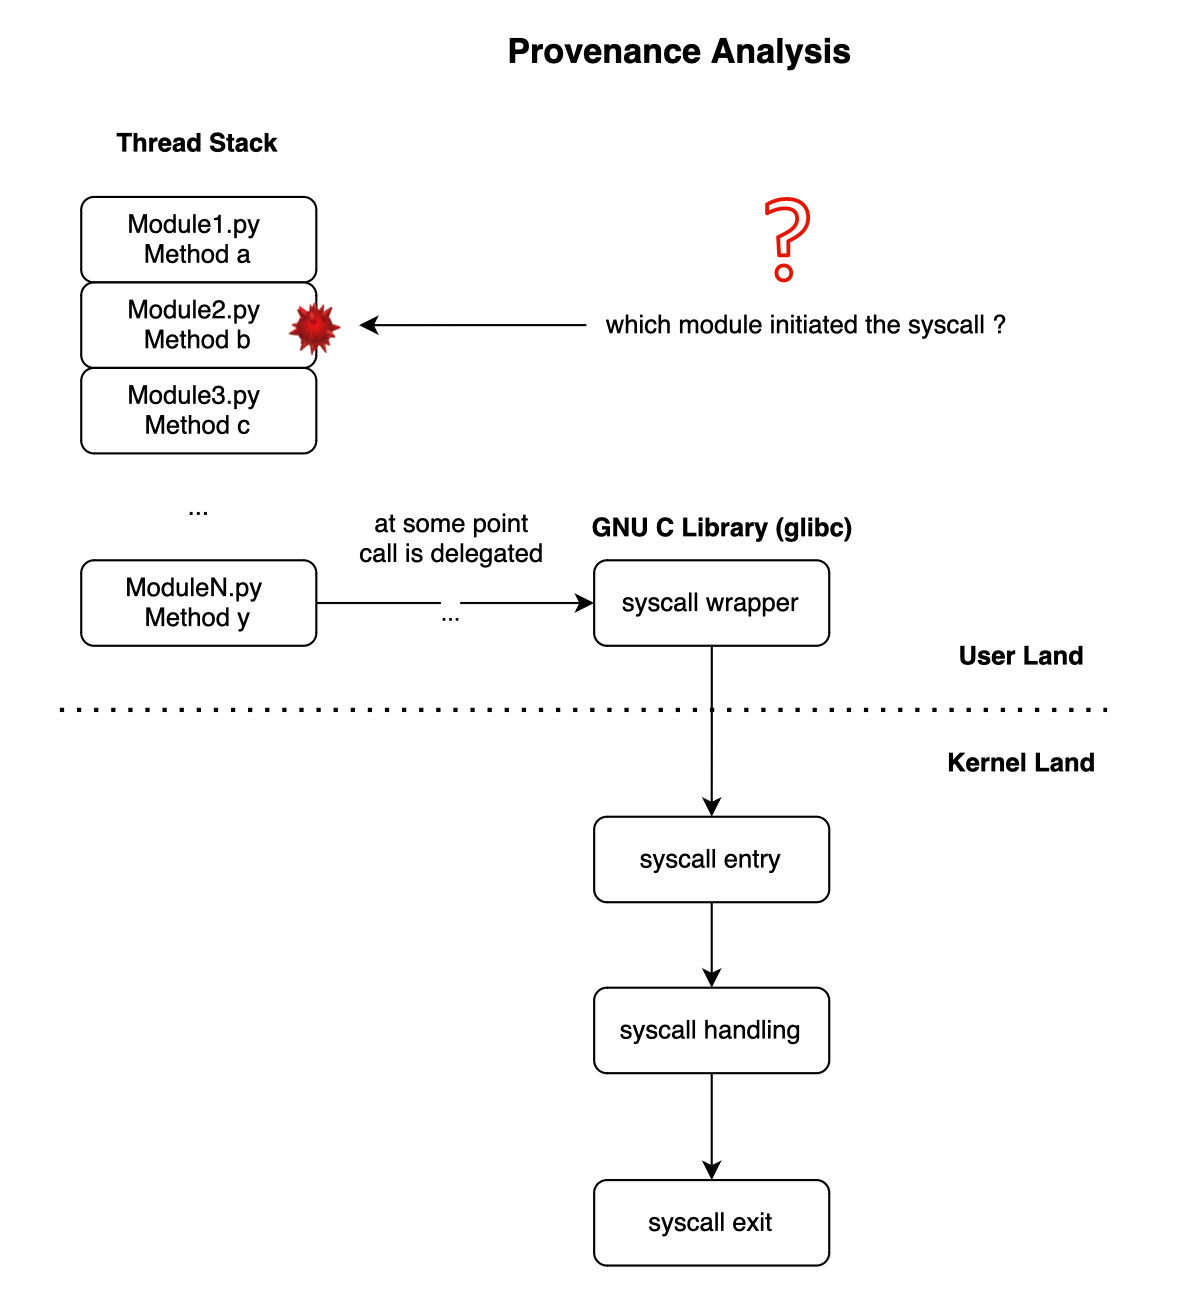
When a system call is issued, we cannot be certain who the original initiator is, as there may be several frames in the stack.
To illustrate this, let's take the fcntl syscall, which is used to obtain and release locks. For example, SQLite uses it, and this can be confirmed below. __libc_fcntl64 wraps the underlying system calls provided by the kernel.
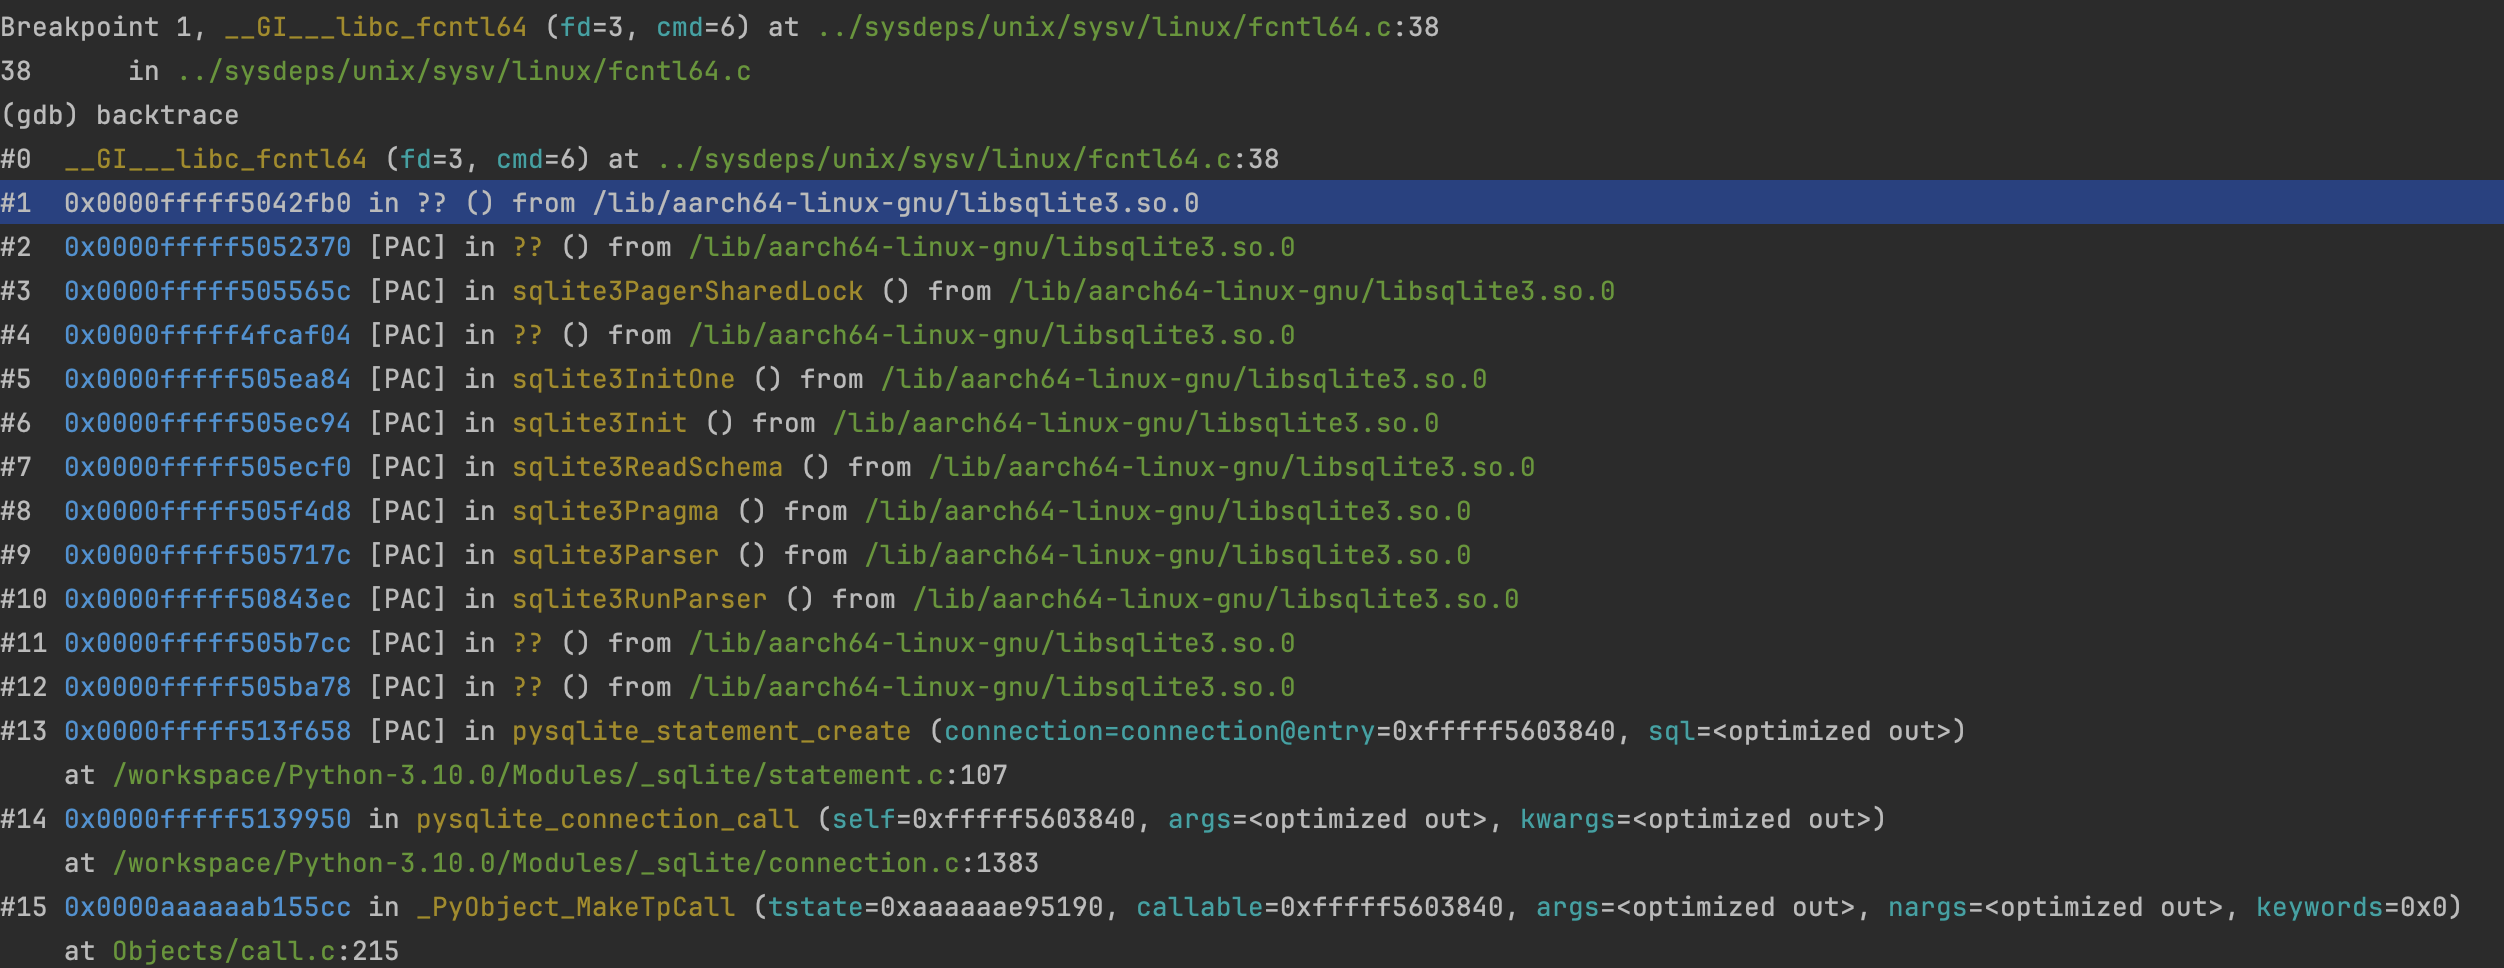
However, usually, it is not trivial to infer the library responsible for the syscall as it goes through several libraries until reaching a wrapped native library that will execute it.
What we can do, however, is track all the libraries active in the thread each time a syscall is fired and assign the syscall to that library during profile generation. Then, we create a sandbox, and if it turns out that a system call is invoked while a library in the stack does not have that profile, a deviation is reported. Because if it were legitimate, we would have seen it during profile generation, right?
I have not seen yet their patent (pending), but this is what https://www.oligo.security is kind of doing (and probably more than just that). I initially tried to use https://github.com/avilum/secimport, but unfortunately, it did not work on my end, and this is why I decided to implement a simple PoC myself.
eBPF or or extended Berkeley Packet Filter is a register-based virtual machine with a total of 11 64-bit registers, a program counter, and a 512-byte fixed-size stack that can execute user supplied programs.
eBPF allows user programs to run in the kernel space without requiring changes to the kernel itself or the need for additional kernel modules.
As one can guess from its name, it was originally created as a way to filter network packets, and then it has evolved into a powerful and flexible tool for a variety of tasks, including performance monitoring, security, and non-intrusive tracing.
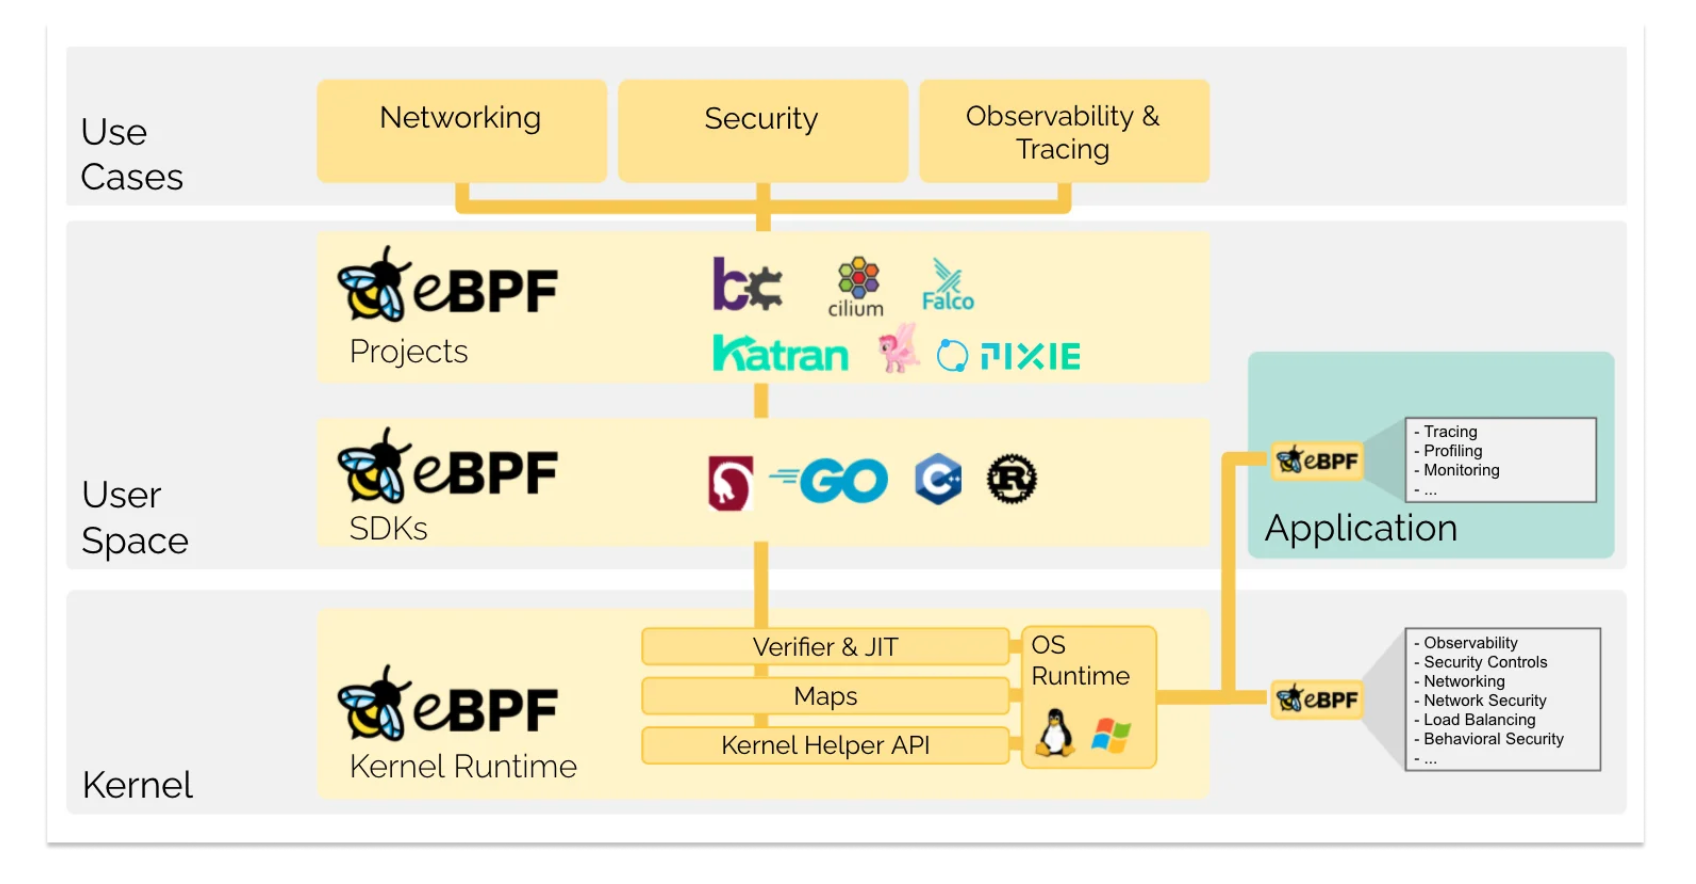
eBPF is widely adopted by industry including Google, Facebook and Netflix and many projects such as Cilium and Falco.
Because eBPF programs can be loaded and unloaded dynamically, they are very flexible and can be used for a wide range of tasks.
eBPF programs can be written in a higher-level language (or assembly) and then compiled into the bytecode using the LLVM/CLang compiler. The bpf() system call is used to load the eBPF bytecode into the kernel, which then validates the bytecode (/kernel/bpf/verifier.c) for security purposes (eg. to avoid out-of-bounds (OOB) memory access, infinite loop ect.).
After validation, the eBPF bytecode is compiled into native machine code using Just-In-Time (JIT) technology. Depending on the function of the eBPF program, the compiled machine code is mounted on different running paths of the kernel. When the kernel runs to these paths, it triggers the execution of the eBPF machine code on the corresponding path.
In this post, we will use eBPF to create first a profile for each python module used and then run a sandbox in order to detect deviations. This is illustrated below.
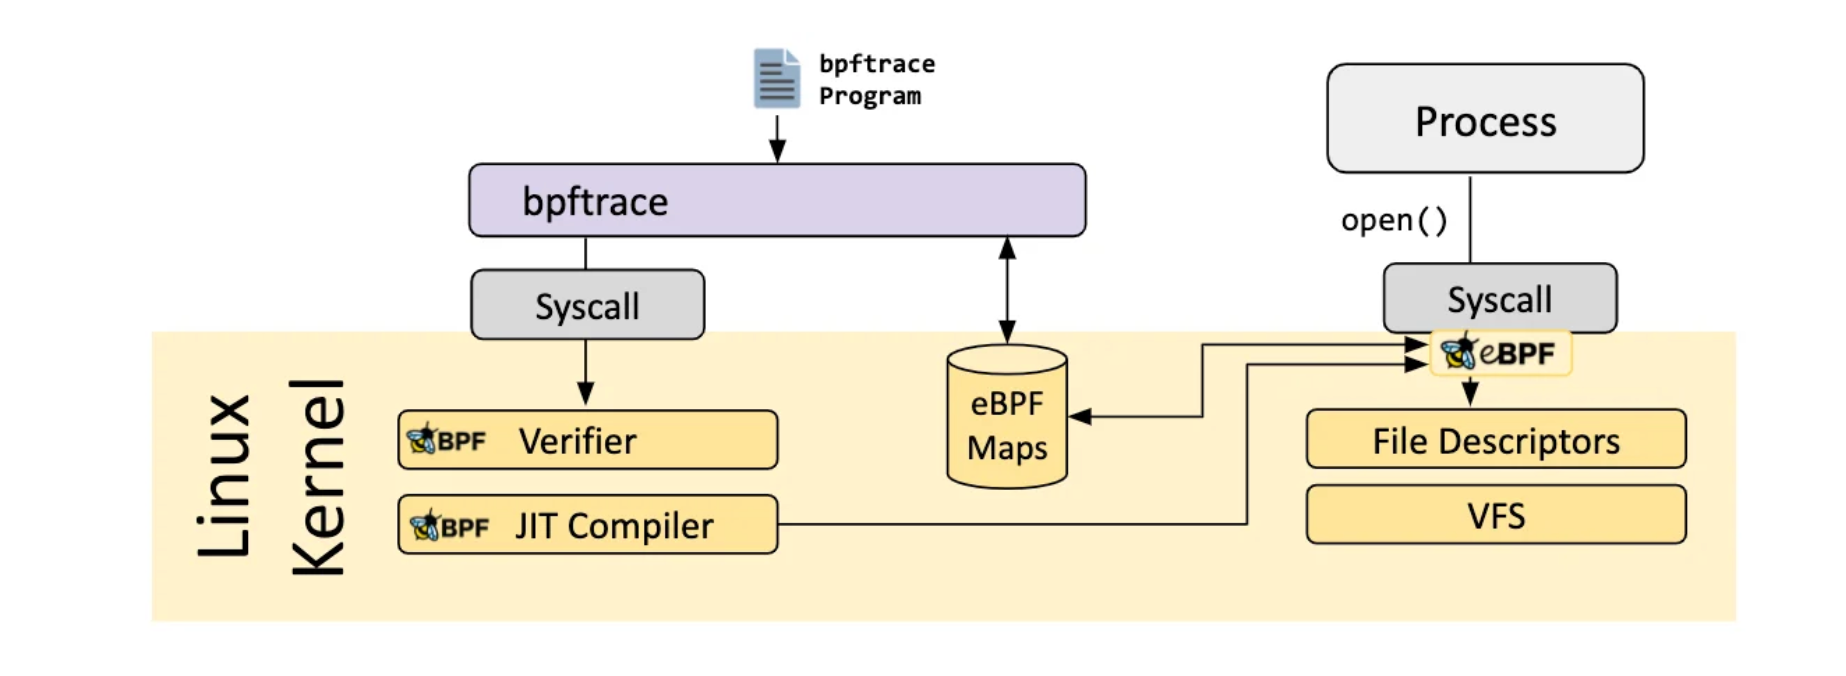
I initially started using bpftrace, as it is high-level and straightforward to use. Here is a basic example how you can use it to trace system calls:
sudo bpftrace -e 'tracepoint:syscalls:sys_enter { printf("Syscall entered! %s %d\n", comm, str(args->id)) }
Other examples can be found at https://github.com/bpftrace/bpftrace/blob/master/docs/tutorial_one_liners.md.
However, at some point I faced two issues that prompted me to use bcc:
Well, I was not really surprised as bpftrace was meant to be used for basic tracing and at some point you would need to use bcc or libpf to develop more complex programs (this is at least my feeling, or just don't know enough how bpftrace works or how it can be fully leveraged).
Anyway, I highly recommend starting with bpftrace if you are new to eBPF and then move to BCC if needed (or libpf).
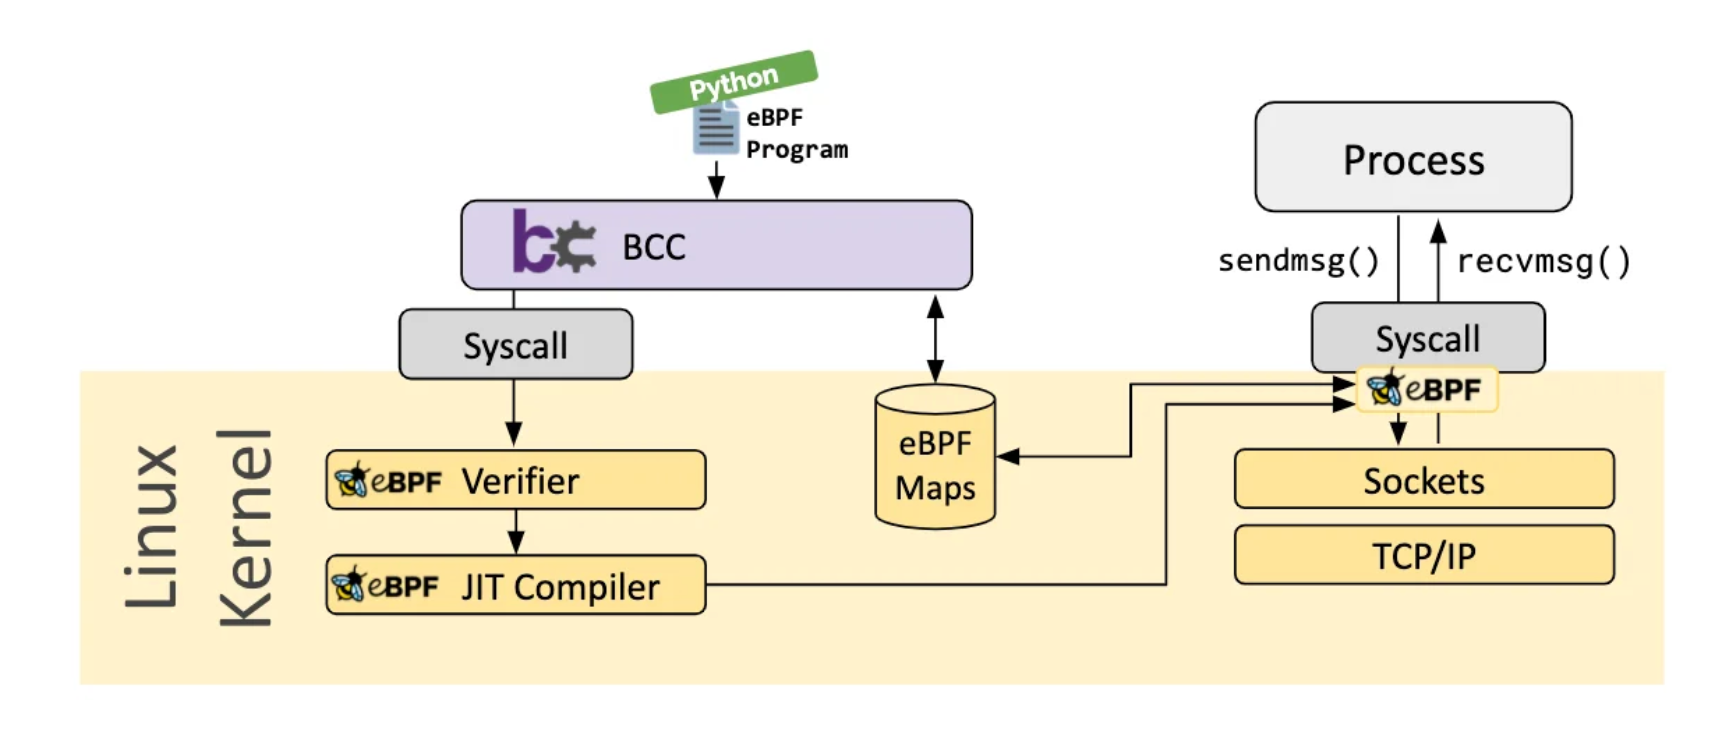
BCC simplifies writing BPF programs by providing kernel instrumentation in C, with a C wrapper around LLVM, and front-ends in Python and Lua. The APIs definitions can be found at https://github.com/iovisor/bcc/blob/master/docs/reference_guide.md.
There are plenty examples on how to use BCC/BPF here: https://github.com/iovisor/bcc/tree/master/tools/lib.
Tracing (syscalls) is very important to detect threats. Tracing programs can be attached to different hooks in the user and kernel land.
With eBPF, we can execute code in the kernel when the an application or kernel goes through a certain hook point like a function entry/exit or system call, without the need to install any kernel module. You can basically put sensors and react to different events almost everywhere:
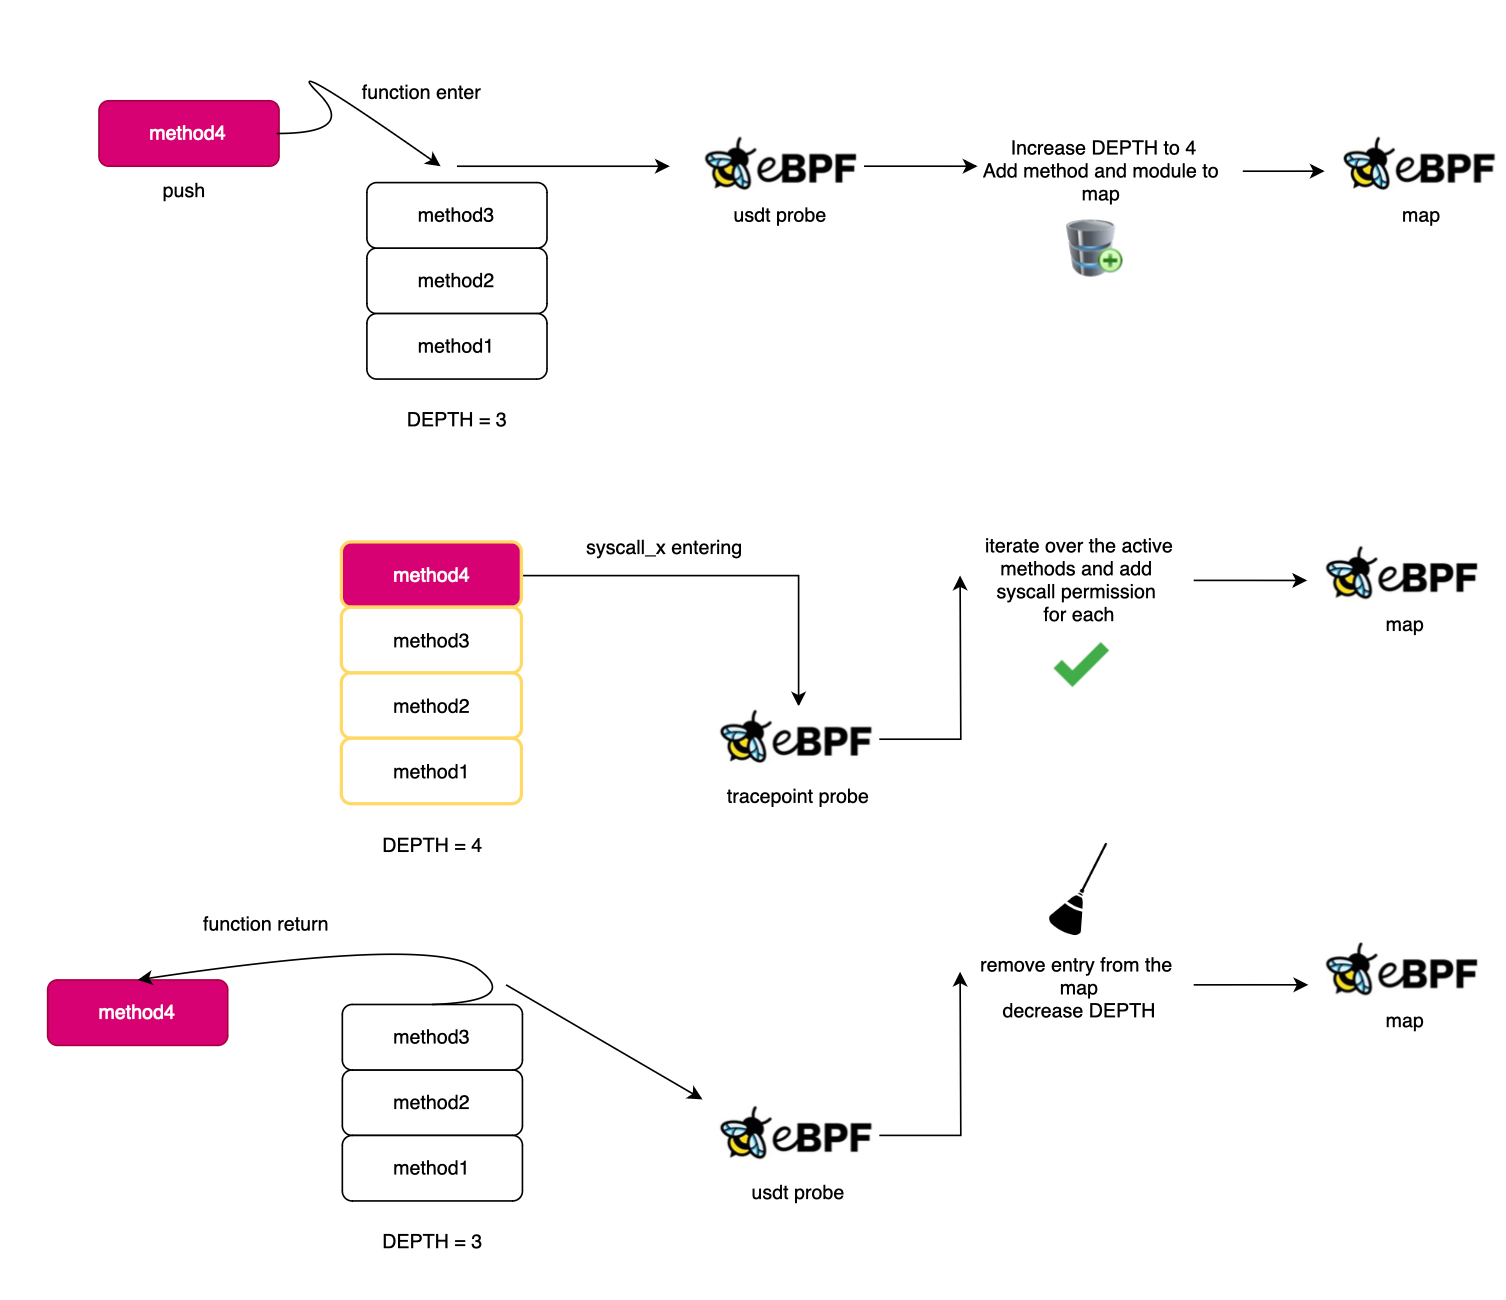
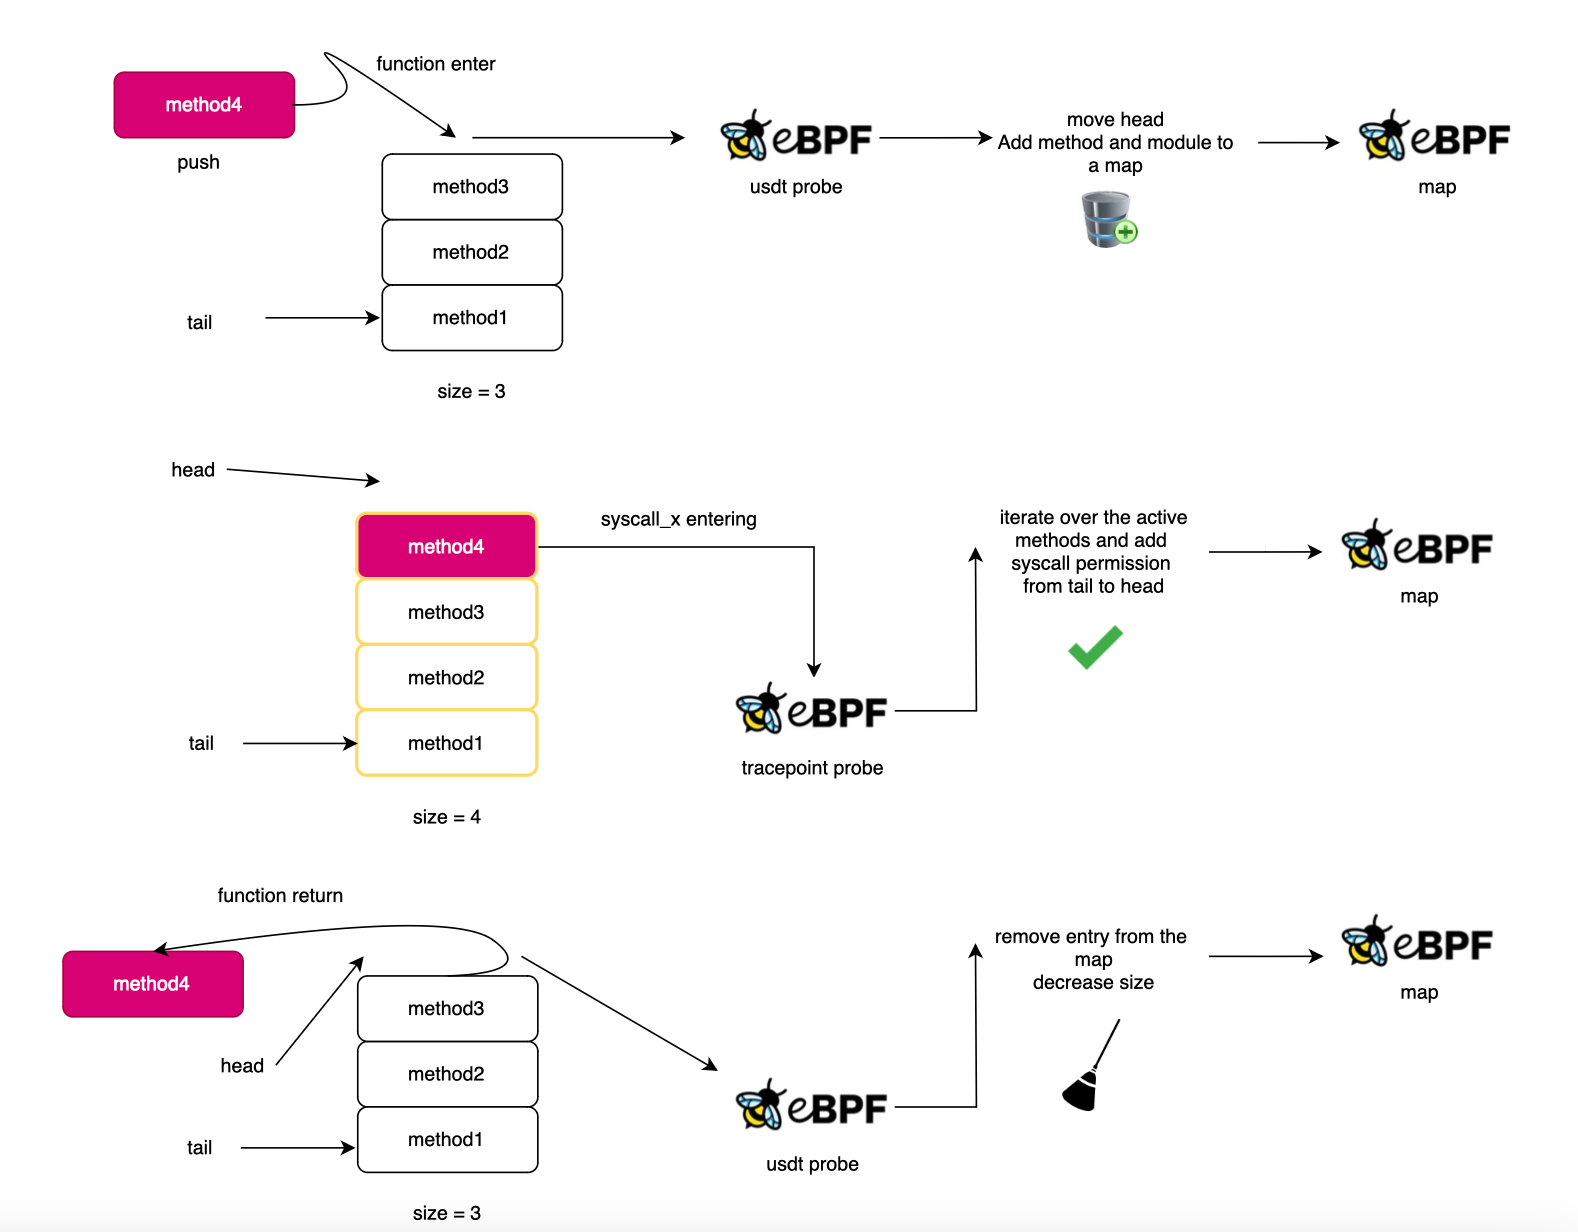
In order to keep track of the application-level stack, we can trace every function entry and return. For this, we can use USDT probes. USDT probes are embedded in the source code, which means you need to compile the CPython interpreter with the --dtrace option. When Python is compiled with DTrace, USDT probes can be fired, allowing us to attach to them.
Here is the list of available probes for python.
By tracking function entries and exits, we can mirror mostly the active user stack (yet not the low level part; only python bytecode is covered thus not the interpreter; remember you will be notified on each python function entry and exit). Then, when a syscall is executed, the relevant syscall tracepoint is triggered.
As discussed earlier, Linux includes hooking capabilities (stable hook point) that allow us to be notified before or after a system call is invoked (sys_enter and sys_exit), enabling us to implement profiling and sandboxing.
You can list available tracepoint using:
sudo ls /sys/kernel/debug/tracing/events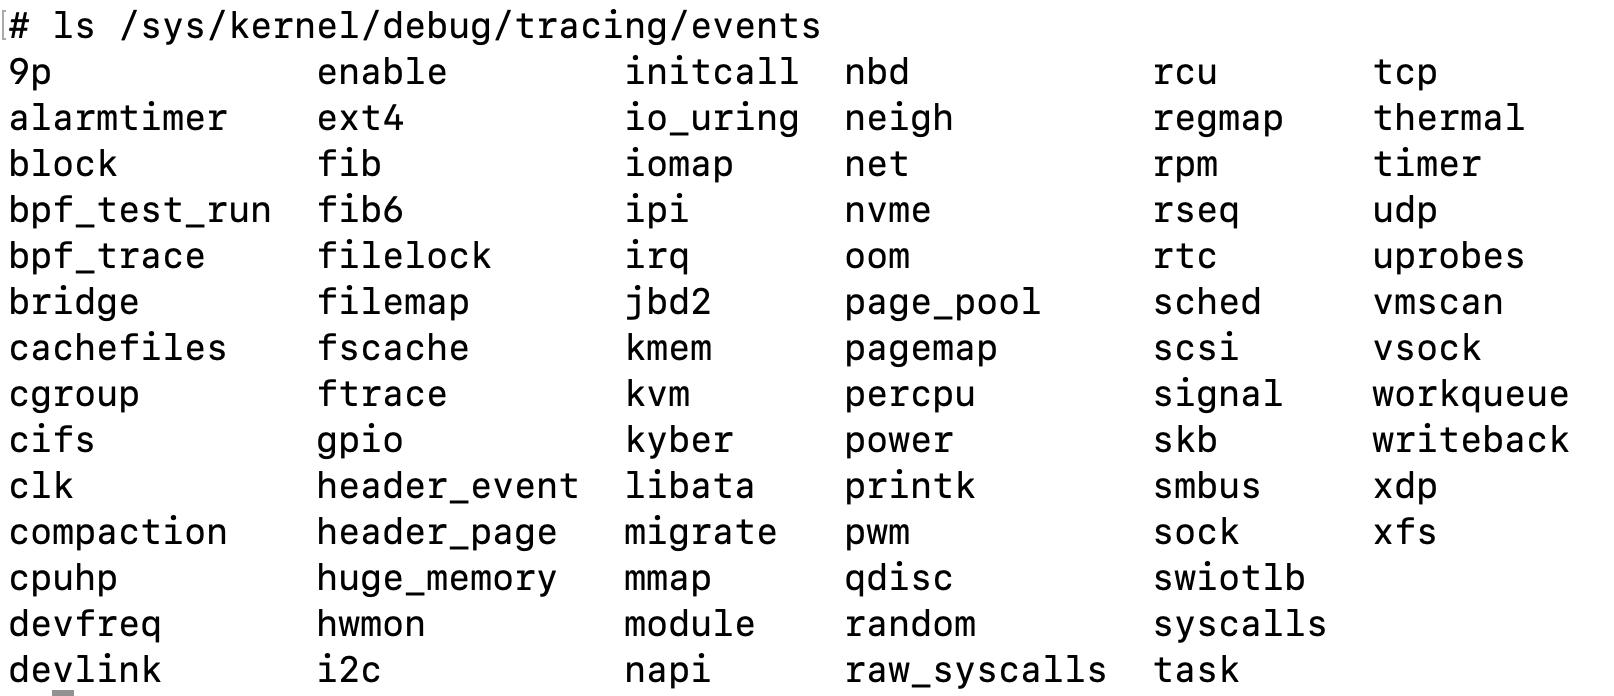
Both bpftrace and bcc code can be found and reproduced at https://github.com/mouadk/library-profiling.
Coding with bpftrace is quite straightforward; however, with BCC, I found it challenging to get something working. It's a subset of C, you can't do anything you want, and you can quickly reach the stack size limit (512 bytes).
The bpftrace implementation for the profiling is as follows:
Here is what code looks like:
#!/usr/bin/env bpftrace

BEGIN {
    printf("🕵🏻profiling starting... hit Ctrl-C to quit\n");
    @max_depth = 100;
}

usdt:/workspace/Python-3.10.0/python:function__entry {
    if (@current_depth[tid] < @max_depth) {
        @current_depth[tid]++;
        @module_tid_depth[str(arg0), tid, @current_depth[tid]] = 1;
        @tid_depth_module[tid, @current_depth[tid]] = str(arg0);
        @module_active[tid] = 1;
    } else {
        // printf("max depth reached !!, profiling results will not be accurate, you may want to increase the depth or use bcc version\n.")
    }
}

usdt:/workspace/Python-3.10.0/python:function__return {
    if (@current_depth[tid] > 0) {
        if (@module_tid_depth[str(arg0), tid, @current_depth[tid]]) {
            delete(@module_tid_depth[str(arg0), tid, @current_depth[tid]]);
            delete(@tid_depth_module[tid, @current_depth[tid]]);
            @current_depth[tid]--;
            if (@current_depth[tid] == 0) {
                delete(@module_active[tid]);
                delete(@current_depth[tid]);
            }
        }
    }
}
Now, each time a syscall is invoked, we will go over the list and add the permission for each library active in the stack for that syscall id. Here is what it looks like:
tracepoint:raw_syscalls:sys_enter {
    if(@module_active[tid]){
        $i = 1;
        if( @current_depth[tid] > 0){
         //iteration count should be statically determined
            while ($i < 100) {
                 if ($i > @current_depth[tid]) {
                    break;
                 }
                 @syscalls[@tid_depth_module[tid, $i], args->id] = count();
                 $i++;
           }
         }
       }
    }
To demonstrate this live, we will use a simple flask application.
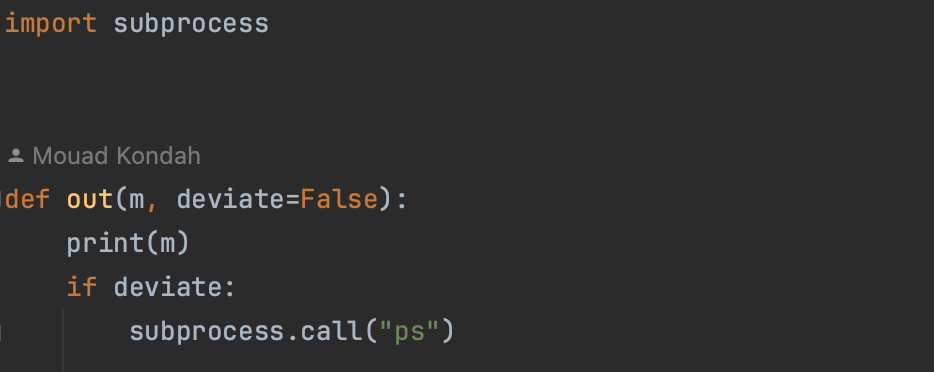
One of the endpoints of the web application uses a library (simple_library) that can deviate once instructed and will be used to simulate our RCE or backdoor use case and check if the bpf program can detect and block it. Here is the definition of simple_library:
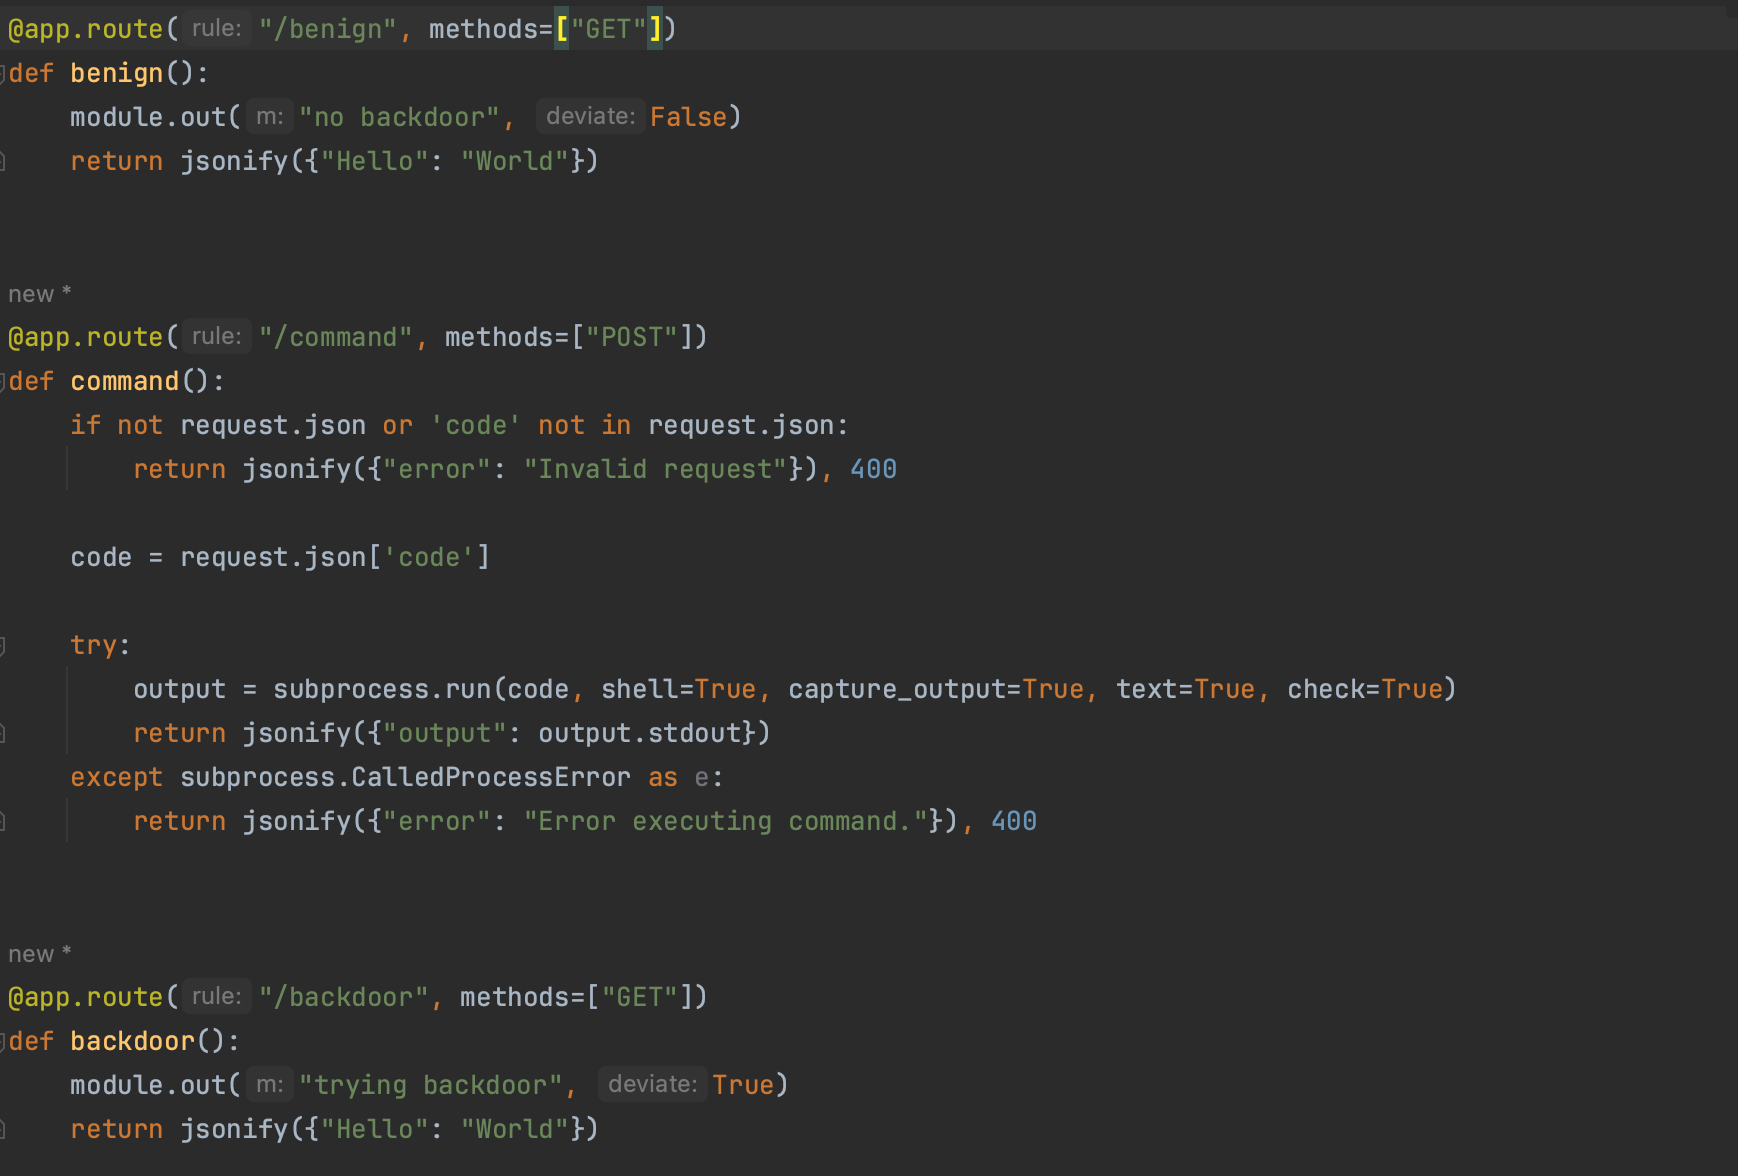
Additionally, in order to verify that our program is capable of filtering out benign use cases, we will define an endpoint /command that start a subprocess. It will be part of the legitimate use case, and we want our algorithm to ignore it and just point out the malicous library, namely simple_library.
The code handling the web request is shown below. The /backdoor endpoint is malicious and will not be executed during profiling.
One can also imagine using the resulting syscalls from the profiling to add another layer of defense by restricting the process to only the observed syscalls.
The sandbox program is almost the same, the only difference is instead of recording the profile we will have a security check, as shown below:
tracepoint:raw_syscalls:sys_enter /comm == "python" && @module_active[tid]/ {
    $i = 0;
    //iteration count should be statically determined
    while ($i < 100) {
        if (@current_depth[tid] > 0) {
             // simulate something like strlen
             if ($i > @current_depth[tid] - 1){
                    break;
                 }
        }
        if (!@allowed_syscalls[@tid_depth_module[tid, $i], args->id]) {
            printf("🚫 Blocked unauthorized system call %d for module %s from TID %d \n", args->id, @tid_depth_module[tid, $i], tid);
            signal("SIGKILL");
            break;
            }
        $i++;
    }
}
Let's run our sandbox.
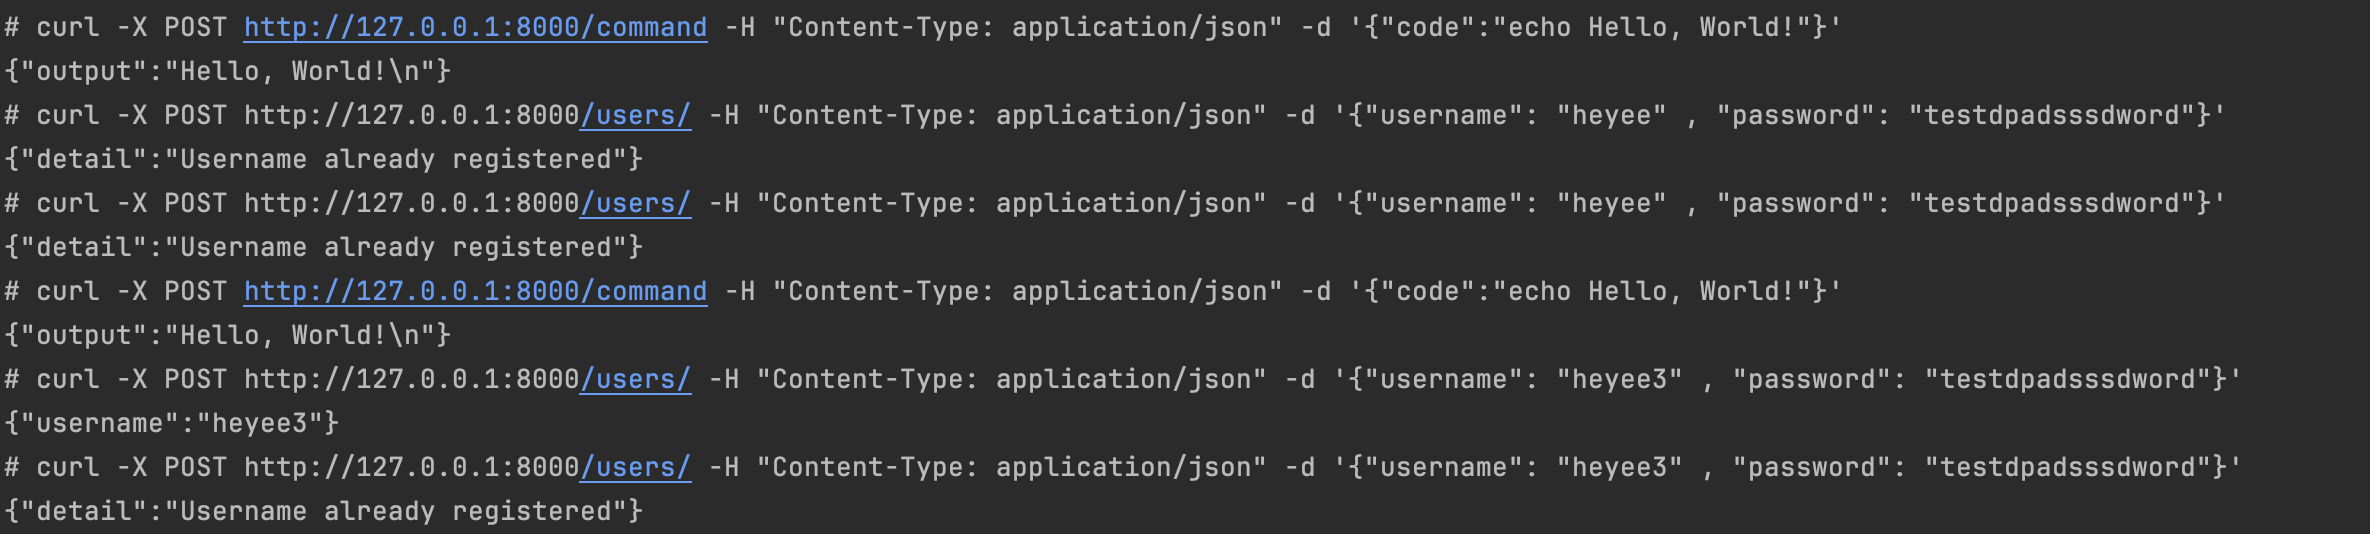
Expected requests work just fine:

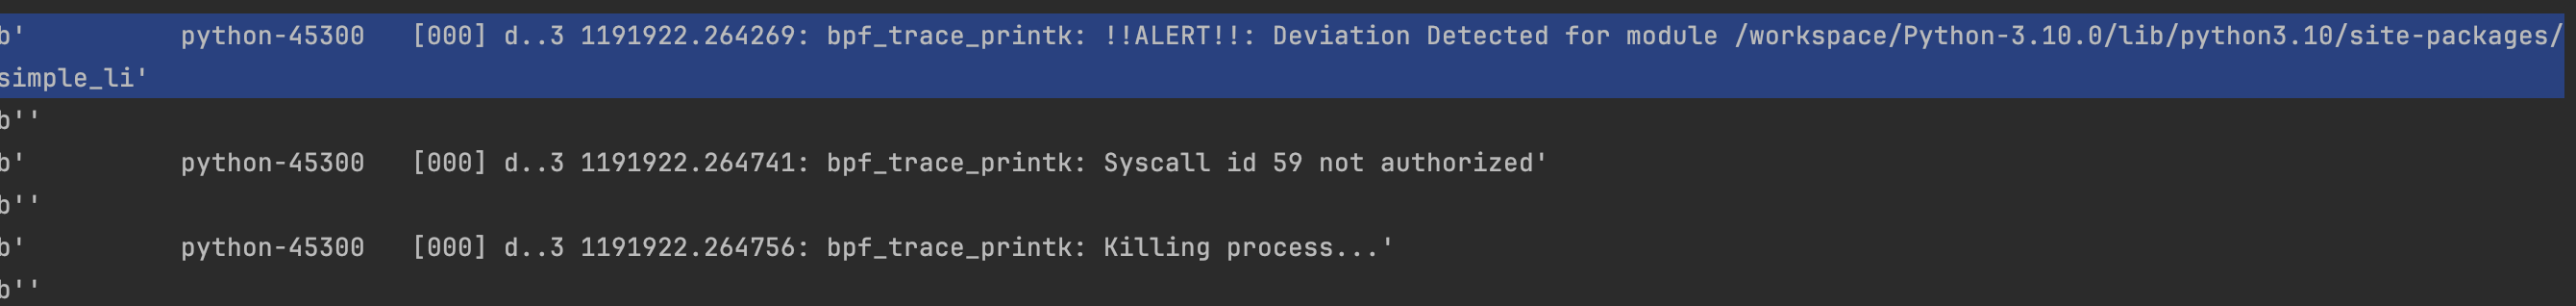
Let's run our backdoor:
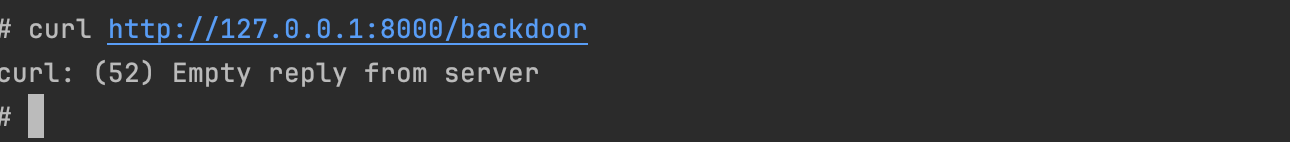

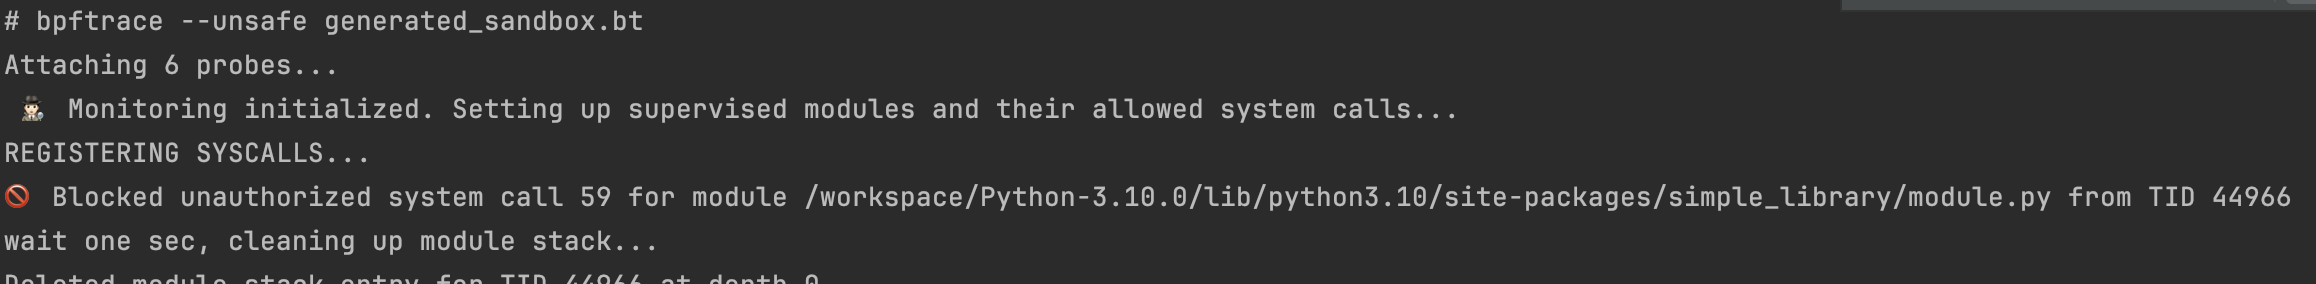
As shown above it was blocked, and as expected, the simple_library was reported.
The implementation in BCC version is different. In bpftrace, we used a straight forward approach by mirroring the user stack watching the function entry and exit respectively.
Here I used a cyclic buffering approach. I keep only the last N active frames. The reason for this is first I wanted to try something else and also because it may happen that you reach the max depth in bpftrace version and loose track.
What prompted me to use BCC is mainly the cold start problem observed when the BEGIN block is large (basically the more you put in the BEGIN block in bpftrace the more it will take for your program to start tracing).
In this version, I use another (slightly heavier) web application. It uses a local database (sqlite) behind the scene but the idea remains the same, test the backdoored library.
Note that BCC does not support adding the same usdt probe to multiple processes [https://github.com/iovisor/bcc/issues/1774].
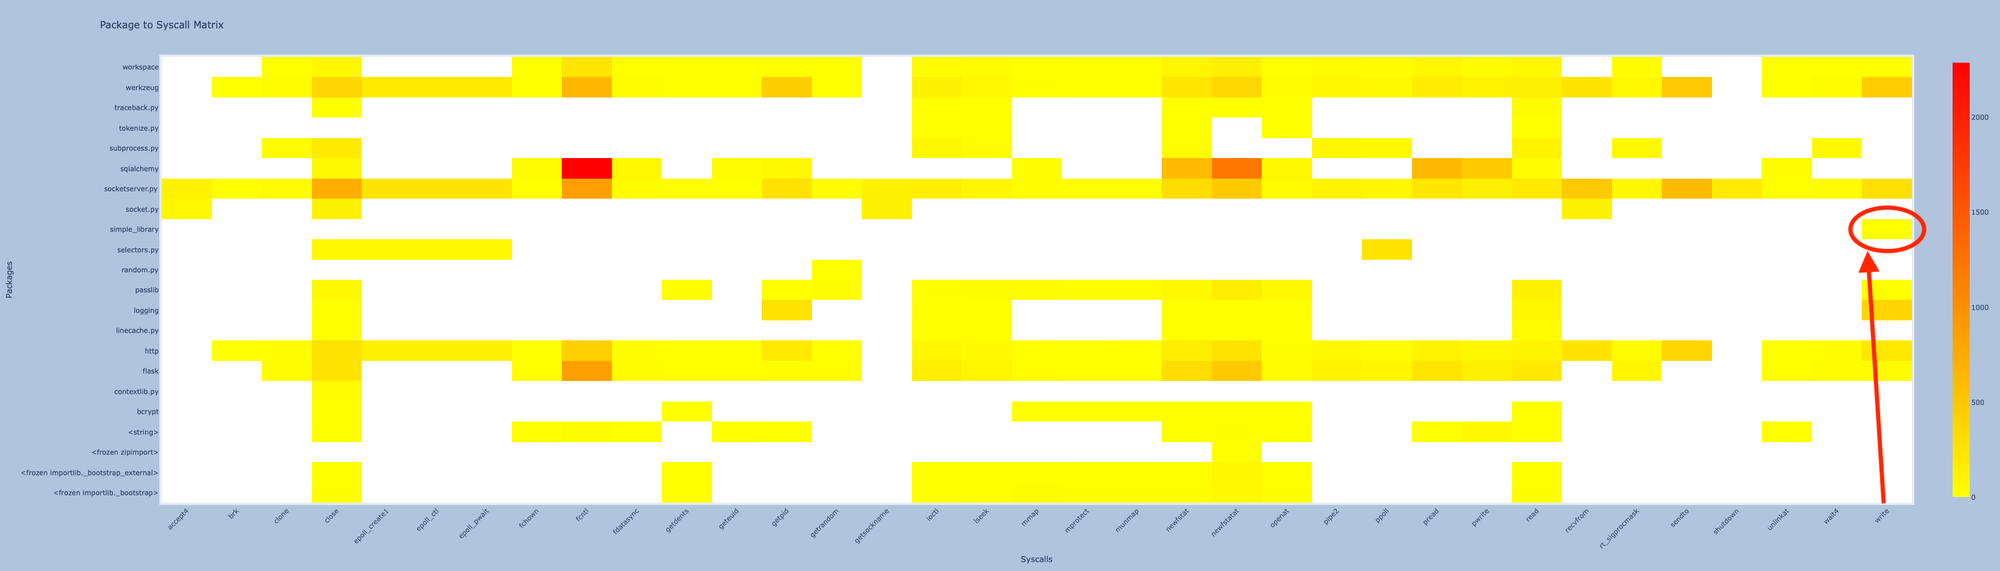
You can see below that the simple_library was not granted other syscall than write.
Ok , now let's run our sandbox.
Expected requests work just fine, as shown below:
Now let's run our backdoor:


As shown above, the process was killed, and the deviated library was reported (simple_library).
Finally, it is very important to trace every possible application path (your profiling should walk every possible and legitimate direction) to avoid false positives.
While eBPF is a rock star for building Linux observability and monitoring solutions, it should be stressed that eBPF was never mean to be a security tool. Security experts consider it terrifying from a security standpoint.
Brendan Gregg said:
eBPF has many uses in improving computer security, but just taking eBPF observability tools as-is and using them for security monitoring would be like driving your car into the ocean and expecting it to float.
eBPF programs exists in the kernel and are invoked once specific hooks are fired such as when a system calls is about to be executed (sys_enter). Ultimately, one needs to consume these events for processing from the user space, and a buffer is typically used for that.
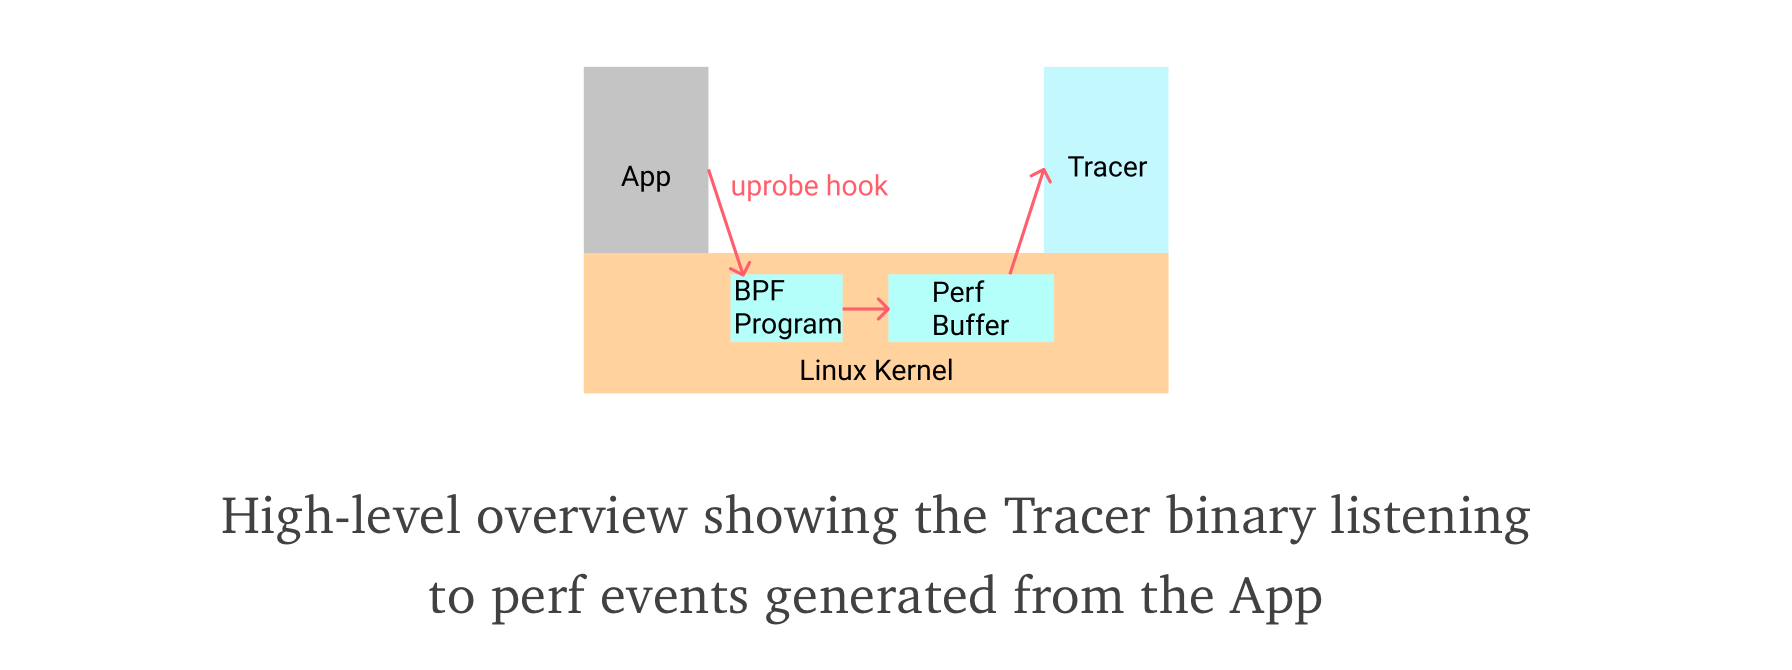
Each time an event occurs, the BPF program push the event in the buffer and continue. However, one drawback of this approach is the user space program needs to be always fast enough to consume and drain the buffer, otherwise, under stress, eBPF would not have enough space to place a event in the buffer and it will be dropped. Thus something that happened would go unnoticed or undetected.
A real world example of this is CVE-2019-8339, where under an extreme workload, system call events could be dropped (say some malicious evens among them) and bypass Falco detection. Of course, this is not something unique to Falco. All security products based on eBPF could be impacted.
The eBPF verifier is responsible for ensuring that user-defined code can safely run in the kernel without causing any harm which makes it an attractive target for attackers.
eBPF programs should not be allowed to navigate kernel memory as they please nor jumping to arbitrary kernel code, this is why the verifier employs a sophisticated analysis and enforce that programs operates within valid bounds.
The eBPF verifier is roughly divided into two stages. First, it uses depth-first traversal to ensure that there are no loops (forming a directed acyclic graph, or DAG) and performs other control flow graph (CFG) validations, such as checking for unreachable instructions or invalid jumps. The second stage checks each bytecode instruction. It simulates the execution of every instruction and observes the state changes of registers and the stack. It checks whether memory access is out of bounds etc.
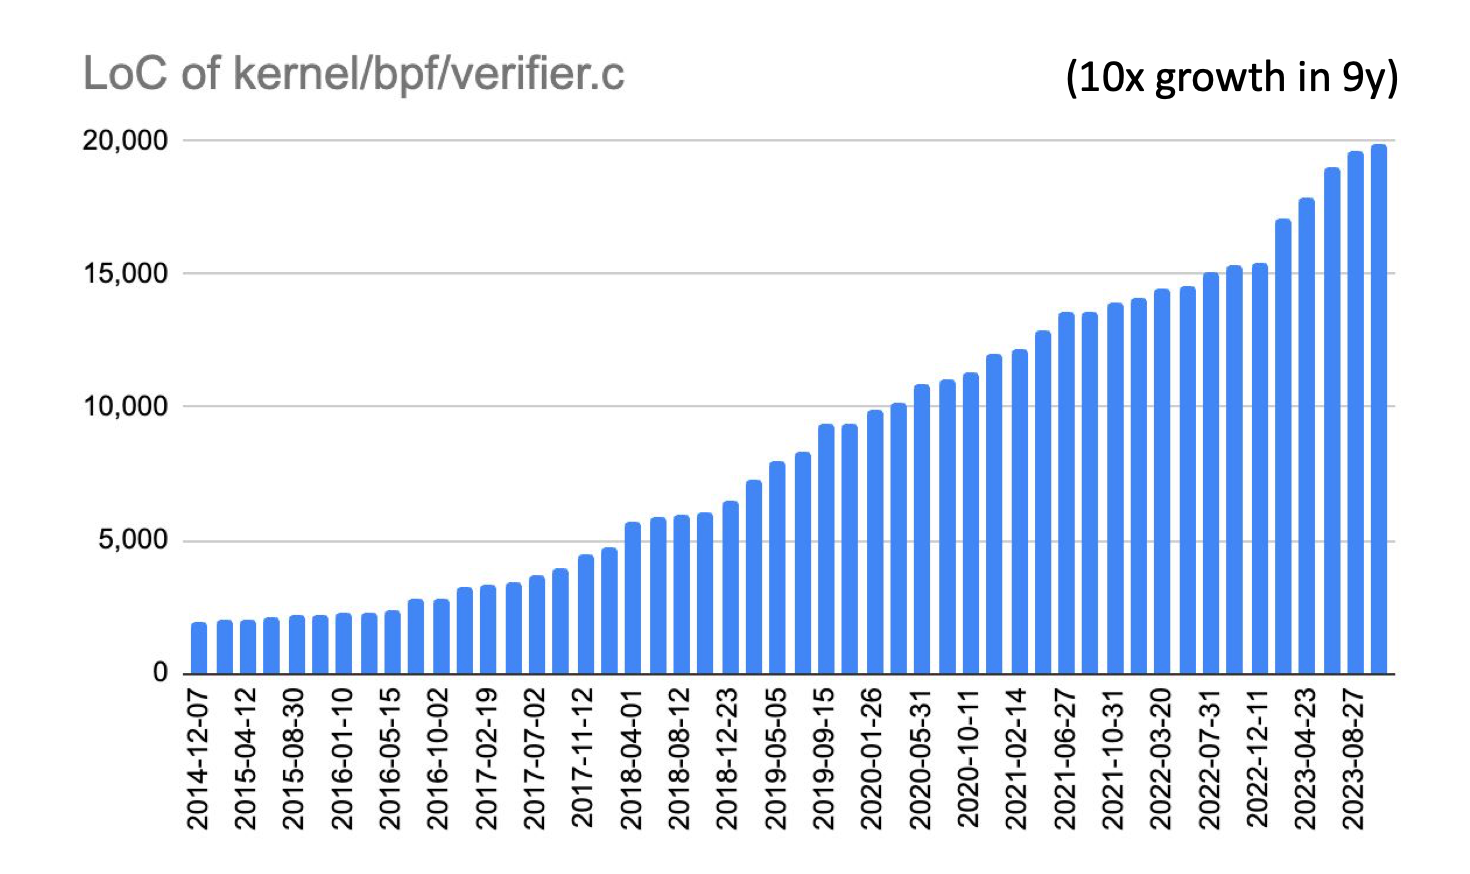
The eBPF verifier is complex and is more than 20k lines of C code, which introduces a diverse set of potential vulnerabilities. Exploiting such vulnerabilities (e.g. CVE-2020-8835.) could lead to sophisticated malware injection, arbitrary memory access, and local privilege escalation (e.g. once you confuse the verifier that a register is 0 you can achieve out of bound access). That is why the reliability of the verifier is of paramount importance.
The security of the BPF programs mainly depend on the eBPF verifier. Bugs in routines in the eBPF verifier will create a huge attack surface, and this is what happened in CVE-2021-31440. The eBPF verifier was not correctly calculating the register boundary for 64-bit to 32-bit operations resulting in out-of-bounds access in the Linux kernel.
This flaw can allow local attackers to exploit the vulnerability and gain elevated privileges. This vulnerability is similar to CVE-2020-8835.
eBPF has a set of registers that correspond to hardware CPU registers, used to store and manipulate data. For example, the instruction
BPF_MOV64_IMM(BPF_REG_3, 7)moves a 64-bit value of 7 into register 3. The eBPF verifier must ensure that the registers do not leave their appropriate storage area to prevent buffer overflow attacks.
In this case, the verifier's boundary constraint calculation was incorrect, leading to a bypass of the validator check and resulting in out-of-bounds read and write in the kernel.
This vulnerability requires the attacker to have access to a malicious eBPF program inside a container, and the container itself needs to have a high level of privileges, specifically CAP_SYS_ADMIN permission.
In newer Linux kernels 5.8 and above, a new permission called CAP_BPF is introduced, which allows users to run eBPF programs and is a subset of CAP_SYS_ADMIN.
By default, privileged containers in Kubernetes inherit the CAP_SYS_ADMIN privileges, which means that unprivileged users within a privileged container can exploit this vulnerability to elevate their privileges to the node and escape the container. This emphasizes the importance of not running containers with excessive privileges.
The fix is shown below:
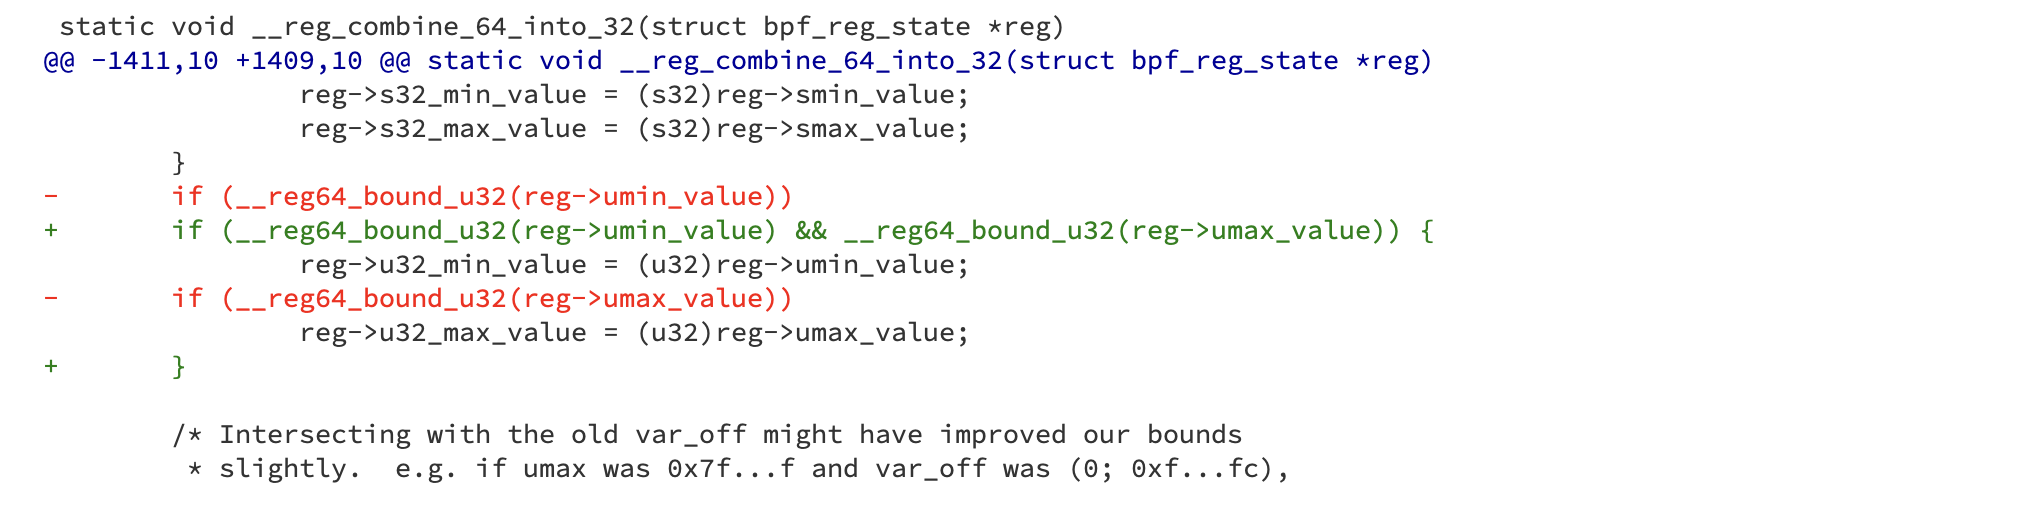
And which includes an additional condition:
__reg64_bound_u32(reg->umax_value)Both conditions
__reg64_bound_u32(reg->umin_value) && __reg64_bound_u32(reg->umax_value)need to be true for the bounds to be propagated.
The above scenario would confuse the verifier and potentially be exploited to chain together a larger attack, leading to local privilege escalation and achieving out-of-bounds access in the kernel. For more detailed information, you can refer to Manfred Paul's excellent article. I plan to write a detailed article on this topic and eBPF if I have some time.
Finally, in order to prevent future verifier vulnerabilities like CVE-2020-8835, one should disallow unprivileged eBPF programs (sysctl kernel.unprivileged_bpf_disabled=1) !.
 iovisor

While eBPF shows promising future for runtime detection, it also poses security issues and can open doors for elaborated attackers to develop sophisticated malware. For instance, consider Boopkit , a linux eBPF backdoor that uses specifically crafted TCP packet for spawning a reverse shell and achieve arbitrary code execution (ACE) on a compromised machine.
Moreover, BPFDoor , a malware linked to a Chinese threat actor, employs a BPF program strategically positioned ahead of the local firewall, evading detection. By intercepting network traffic at a low level, BPFDoor patiently awaits "magic" packets from a command-and-control (C2) server, highlighting the stealthy and persistent nature of modern cyber threats.
Using eBPF for security requires profound knowledge of the internals of the Linux kernel. This is because there is a large set of available hooks to place your sensors, and choosing the right spot is crucial to monitor the system effectively, as we will discuss in the next section.
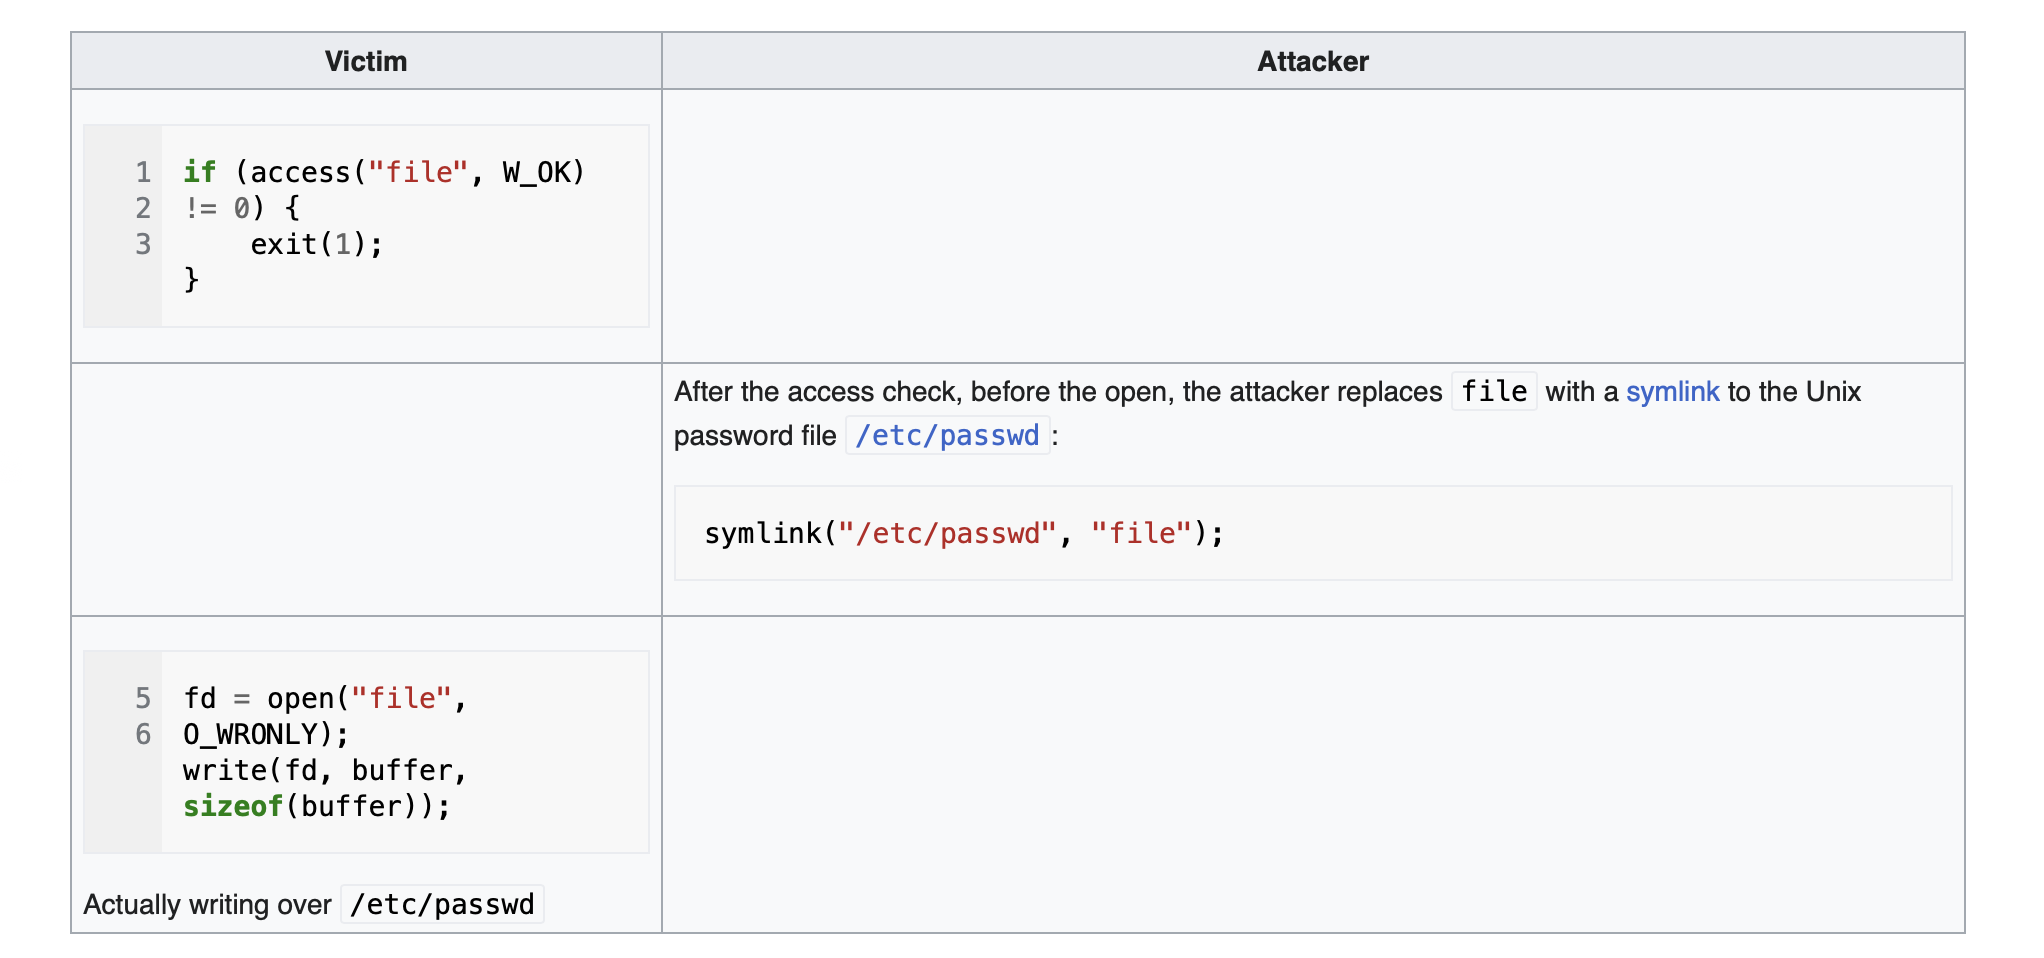
TOCTOU (Time Of Check To Time Of Use) is a vulnerability that occurs when a program checks the status of a resource, such as a file or a network connection, and then uses that resource based on the result of the check. However, between the time of the check and the time of the use, the status of the resource may have changed, leading to unexpected behavior or security issues.
Suppose there is a program that verifies the existence of a file and then opens it for writing. Attackers can exploit the TOCTOU vulnerability by rapidly redirecting the file using symbolic links between the verification and opening steps. This causes the program to write to an unintended file. However, exploiting this vulnerability can be challenging for attackers because they need to be very precise and extend the delay between verification and usage, and sometimes even retry the attack repeatedly until they achieve success by using the correct sequence. You can have a look this talk to understand how one can create a delay and have a reliable exploit.
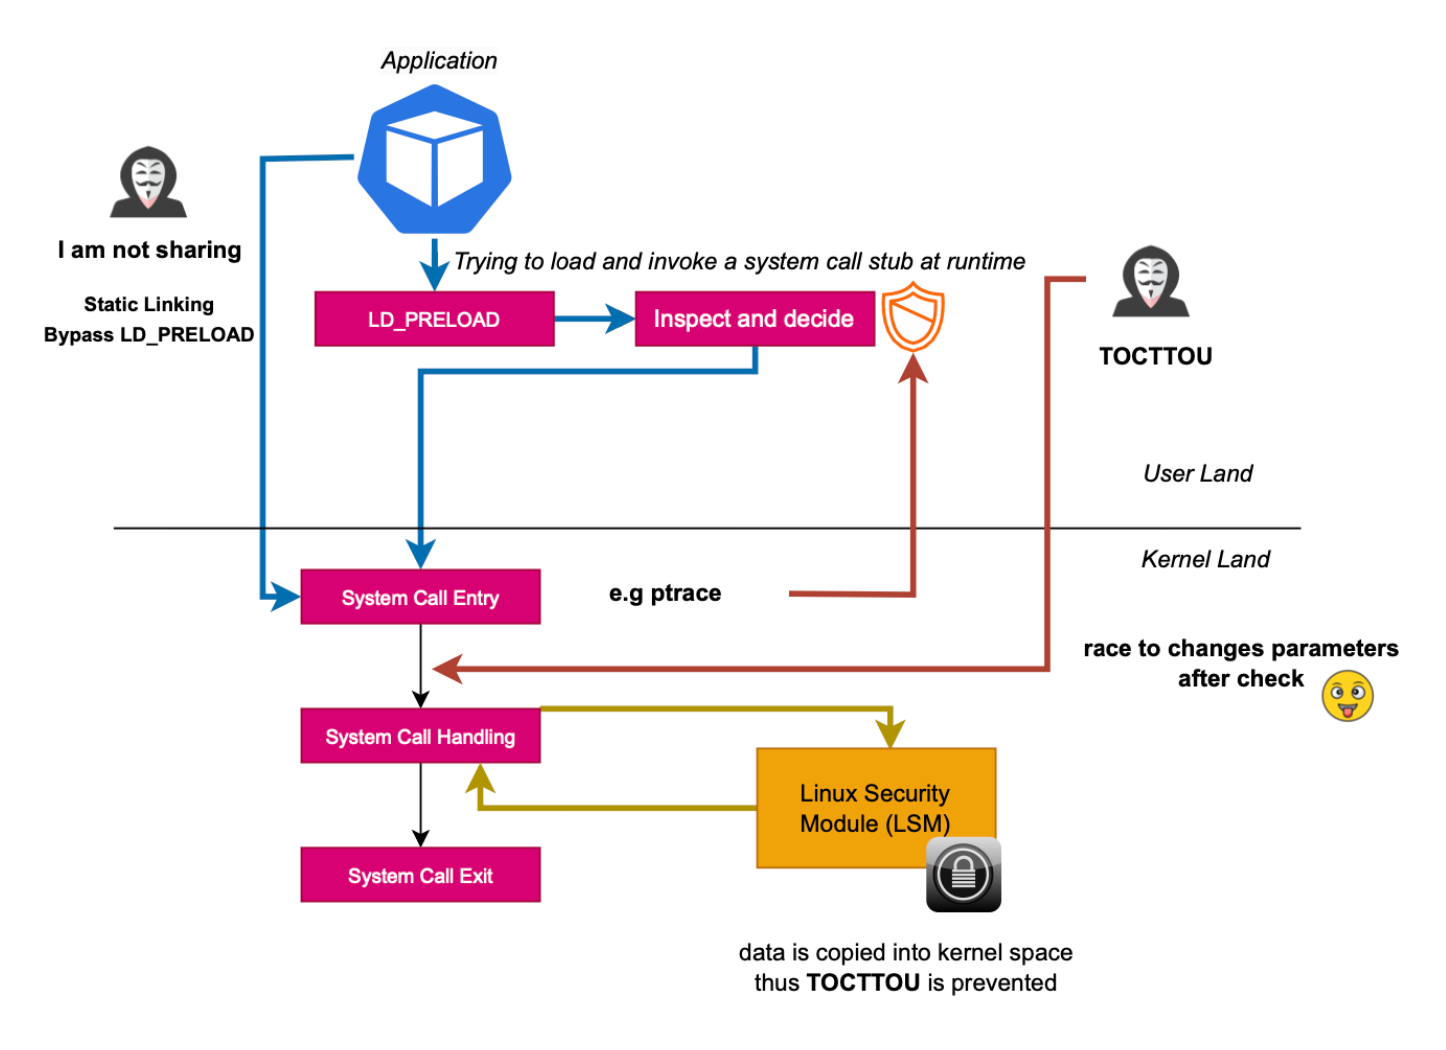
Security products using eBPF can be vulnerable to TOCTOU attacks, depending on where the hooks are positioned. For example, tracing system calls at the entry level can be vulnerable to TOCTOU (https://www.lacework.com/blog/threat-detection-and-response-tools-are-built-on-shaky-foundations-leaving-your-cloud-workloads-at-risk). The arguments are accessed from user land when the BPF program is executed. There is a time window where one could achieve a race condition and change the parameter before the actual system call is handled or in other words, before the kernel copies the data within its own data structure and actually handle the syscall. This is basically why in seccomp-bpf, it is not allowed to dereference user space pointers.
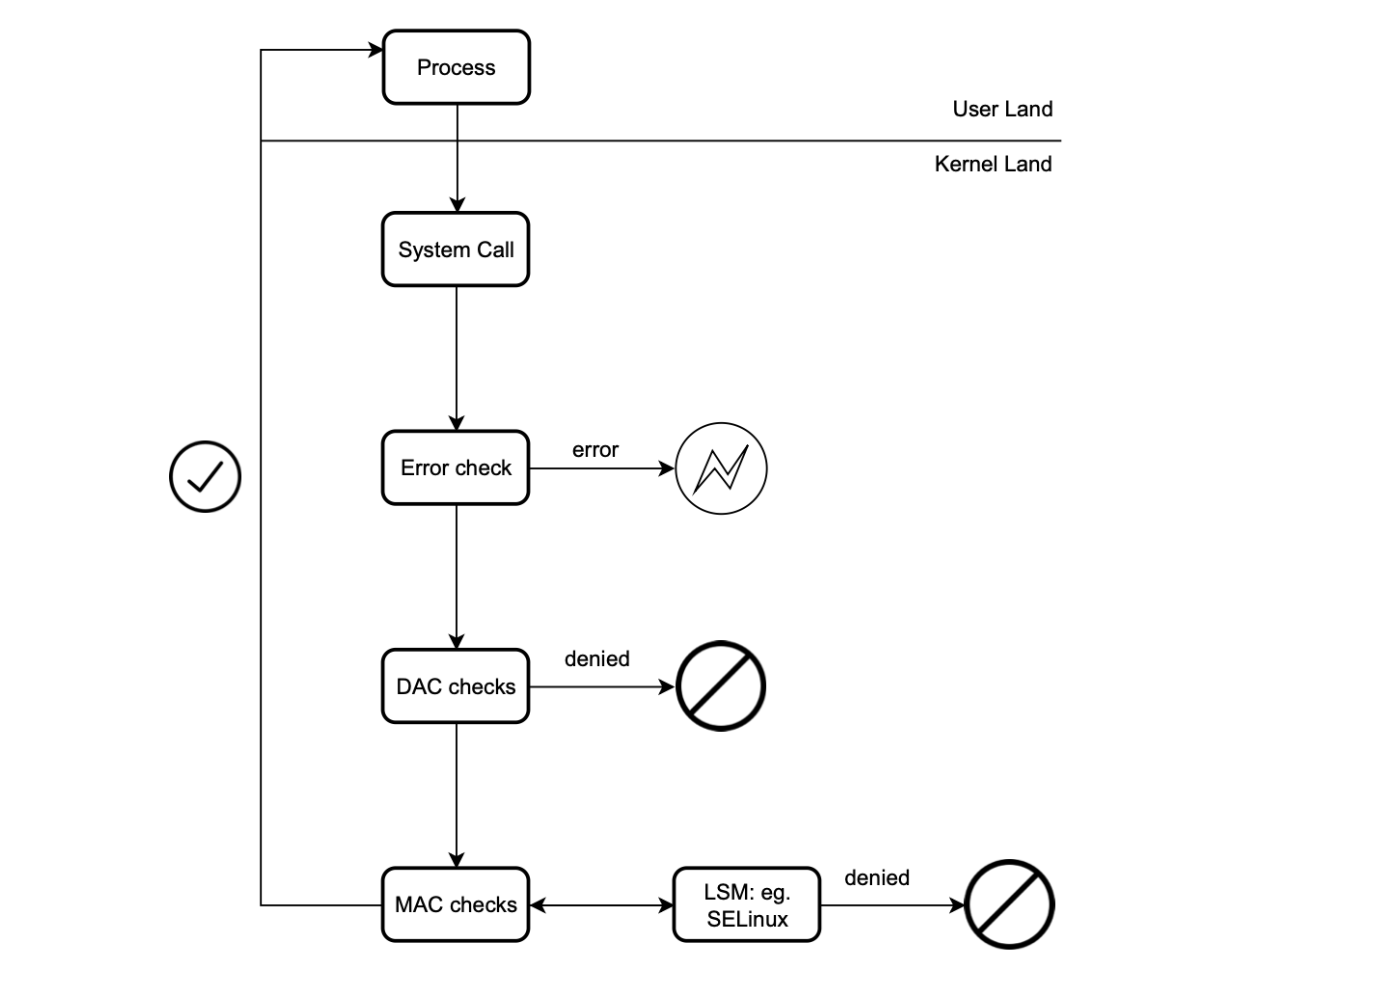
In order to prevent TOCTOU attacks, one should define security routines to be executed after the data has been copied to the kernel land, where the user program can not operate on, or in other words, position the probes much deeper in the kernel. One can use kprobes like Tetragon, or use Linux Security Module (LSM) API (BPF LSM).
While eBPF reduces context switch by executing safely user programs in the kernel, it depends how far you take the observability.
For example, with eBPF, you can trace user space execution flow as we discussed in this post. However, putting your probe at a function level would add 2 context switches that did not exist before and would probably have some impact on the performance of the application you are tracing if the tracepoint is in a hot path ( uprobes requires two 2 switches) . Of course, there are some application where performance is not a critical concern. Existing benchmarking tools include https://github.com/Vali-Cyber/SecurityPerf.
If performance is critical concern for you, you can have a look at bpftime, a user mode eBPF runtime based on LLVM JIT/AOT (x 10 faster, compatible with kernel mode eBPF; not yet recommended for production).
To sum up, eBPF can be used to build next-generation security tools, as the observability it provides is quite impressive, but only if all its pitfalls are accounted for and the additional attack surface that eBPF may expose is addressed.
Let's wrap up. What can we do with eBPF ?
However, not all attacks are system call related, you can still have memory related attacks. Additionally, this should be payed attention to:
Well, RASP can still be efficient. I think the main issue with RASP is its complexity and the need to include too much noise in the implementation to avoid bypasses. This is primarily because there is no protection ring, or at least most solutions suffer from this (with modern Java, it will be very hard to bypass RASP. This is because Java introduced modularity and encapsulated internal APIs). Finally, RASP is highly dependent on the programming language, and its tracing capabilities are very limited in a distributed environment.
I hope this post was helpful, your feedback is highly welcome.
If you think I missed or misunderstood something, feel free to correct it.
 Alex Crawford
 Show all articles by Matan Liber
 Trail of Bits